Add a Plot to a Graph

You can add additional data points to a graph as a way to compare data. Using the graph created in , you'll add additional plots showing other error levels.

  1. Go to the graph created in Create a Graph.
  2. Click Add Plot in the lower-left corner of the graph.
  3. For System Fields, select All Lines.
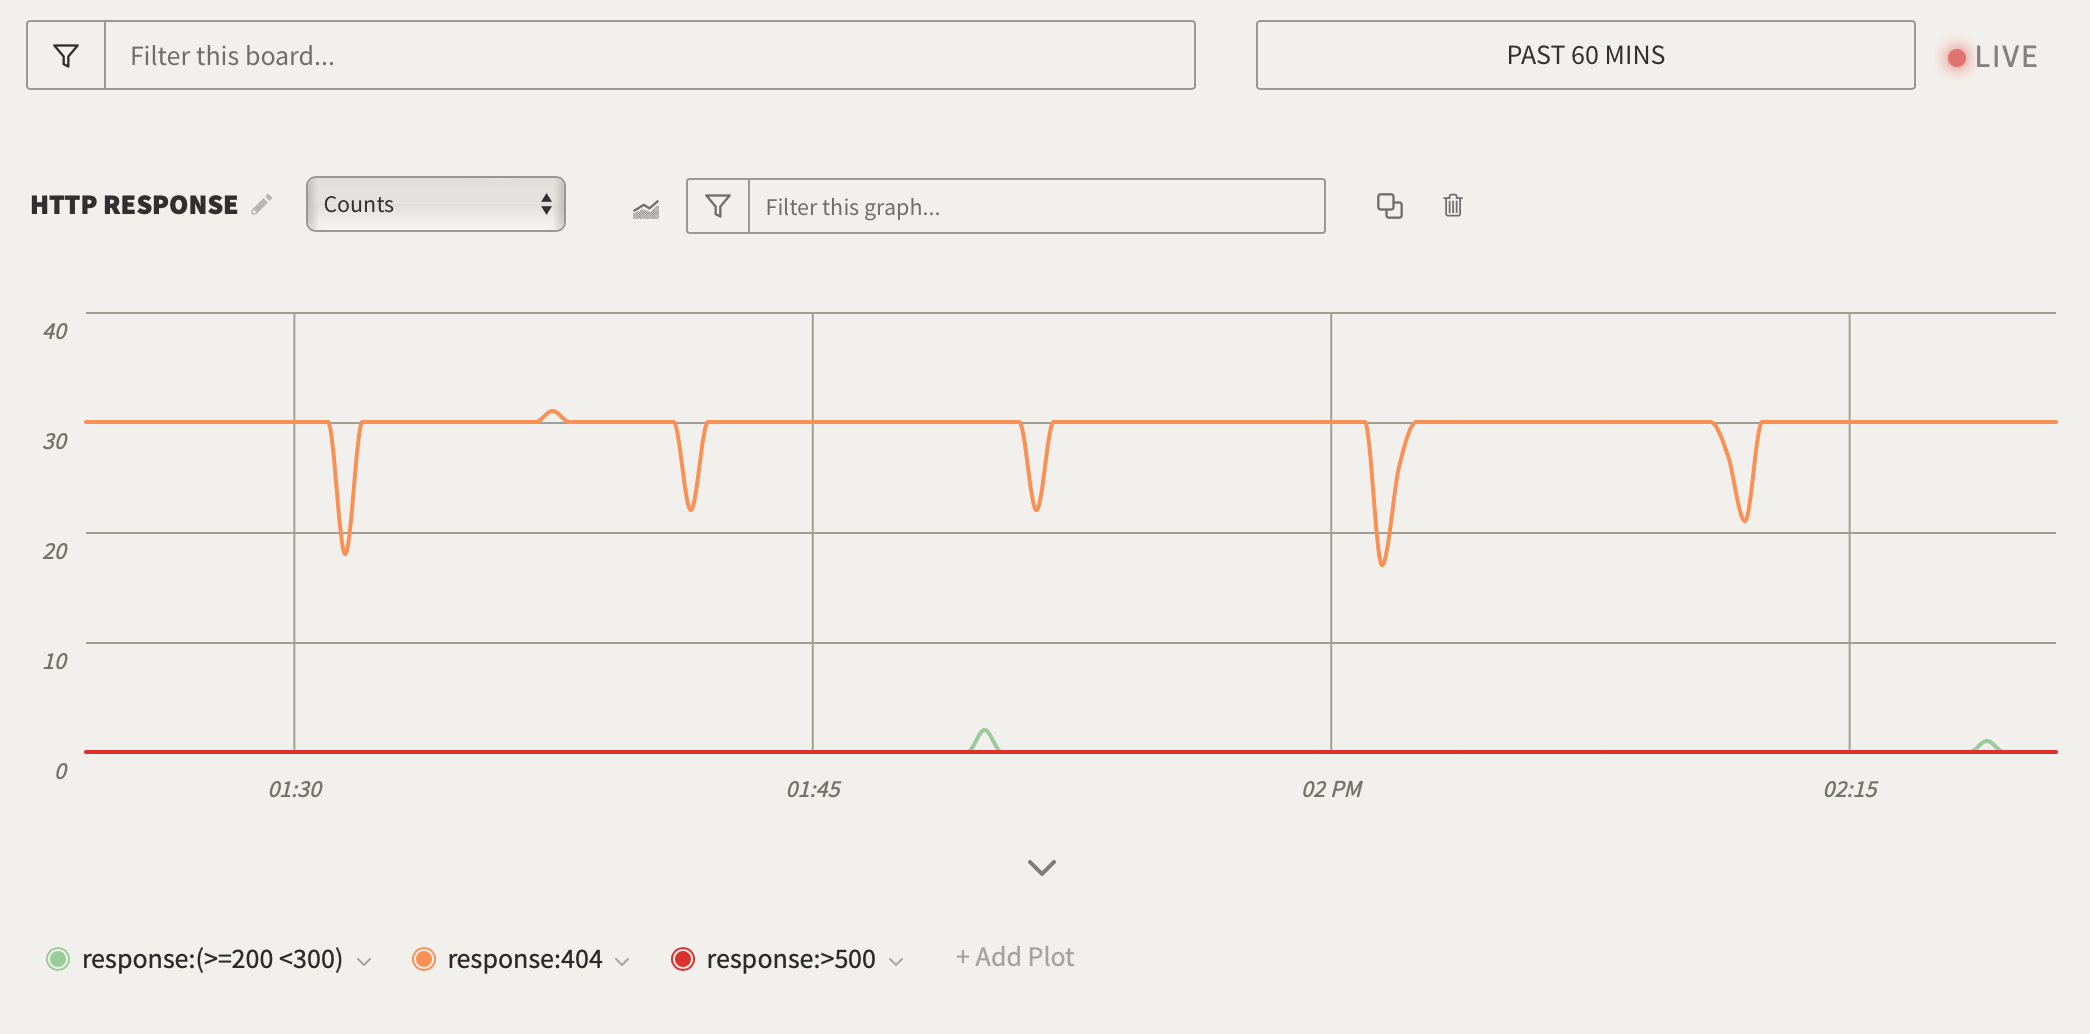
  4. For Optional Plot Filter, enter response:404 to return all 404 codes.
  5. Repeat steps 2 - 4 to add response:>500 .
  6. Click the Save button to add the new plot to graph
  7. Change the line color by clicking on the colored icon beside the plot value.

Next, you'll add a breakdown to show which app is creating the most error messages.

Type to search, ESC to discard
On This Page
Add a Plot to a Graph