

Kubernetes Events
Knowing what is happening in your cluster alongside of your application log lines can be a valuable tool in debugging problems in your deployments. With the Mezmo Agent, you can now do this.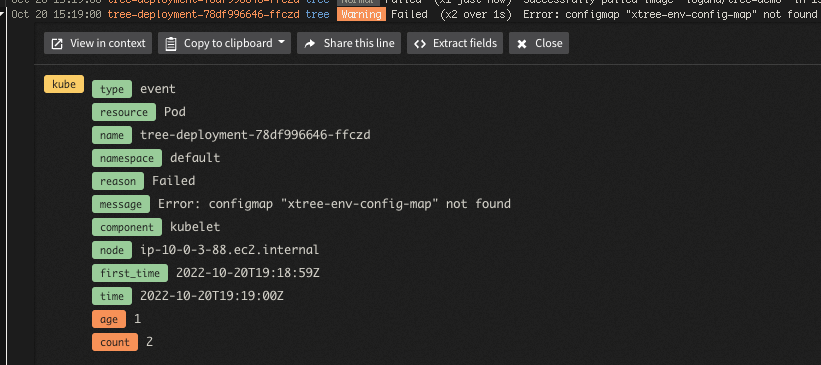
Kubernetes Metrics Reporter Enriched Lines
This feature is only available for customers on an Enterprise plan, and is restricted to Owner and Admin user roles. Please contact your Customer Support Manager or support@mezmo.com for more information.
- In the Mezmo Web App, under Views, select a view that contains lines from your Kubernetes cluster.
- Click the arrow next to a log line to open the information pane for that line.
- Click the arrow next to Kube Stats to view metrics including CPU usage and memory for the pod and node associated with the log entry. All metrics have the same retention as your log retention, and metrics are collected every 30 seconds.

Collapsed view of Kube Stats
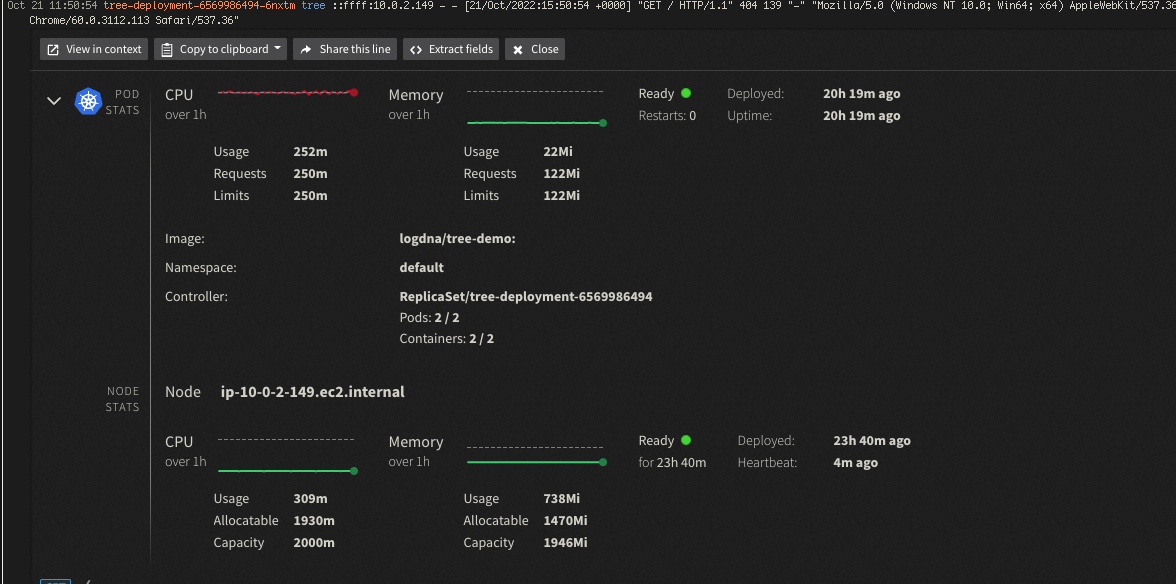
Expanded view of Kube Stats
- Events associated with the log line
- Line identifiers
- Labels
- Diagnostics
Cluster Tag to Distinguish between Multiple Clusters
When you are sending log lines to Mezmo from multiple similarly named namespaces and pods you will need to add a value to theMZ_TAGS environment variable.
Please add a tag that is prefixed k8sclusterkey (for example k8sclusterkey_prod-clstr where prod-clstr is a unique cluster name). This will allow enrichment to distinguish between the clusters when the nodes are similarly named.
This will also add a new line identifier called Cluster to your log lines that you can search for.