

Detecting Errors
If errors are not detected, they can have serious consequences. Logs help us understand the cause and impact of errors, including when they happened, what happened, and what needs to be done to fix them. This information is useful for understanding and fixing errors. This graph shows log lines that contain the worderror over time.
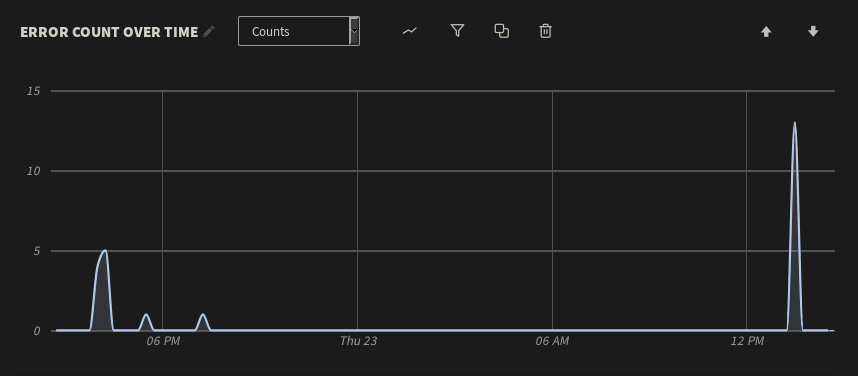
The graph shows the count of logs that contain the word error over a certain period of time.
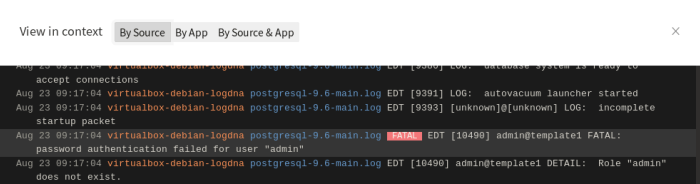
View log lines in context to see lines surrounding the log line
Detecting Unusual Behavior
Log volume is a basic but important metric. Sudden changes in log volume can indicate errors, software or hardware failures, performance problems, or problems with the logging infrastructure itself. Restarting a server naturally results in a surge in log volume, which we can easily detect by charting log volume over time. However, any other surges could indicate larger problems. As shown below, our virtual machine experienced two major spikes in log volume followed by a period of relative inactivity: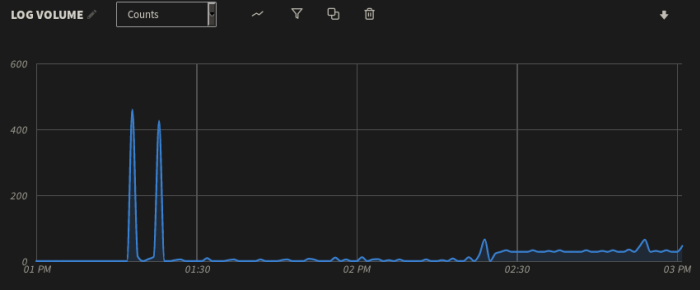
Graph of a virtual machine showing two log spikes
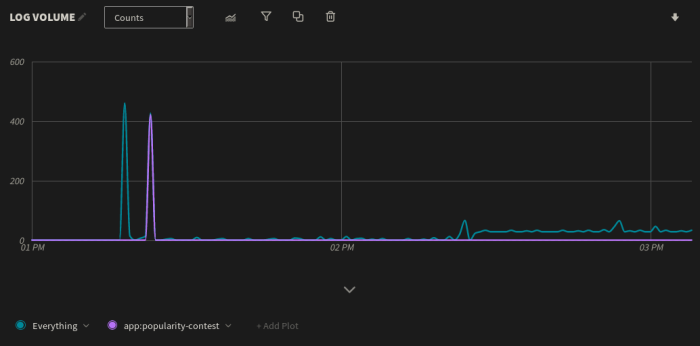
Graph showing log spikes filtered by app name to determine which apps or processes were casing the spikes
Investigate With Histograms
You may want to count log volume by a specific field, such as the log-level, host, application, or a custom tag. For example, plot out log volume based on the service that generated each event (stored in the app field). In the example, you can see, the popularity-contest service generates the greatest number of messages, followed by the virtual machines syslog service and daemon log.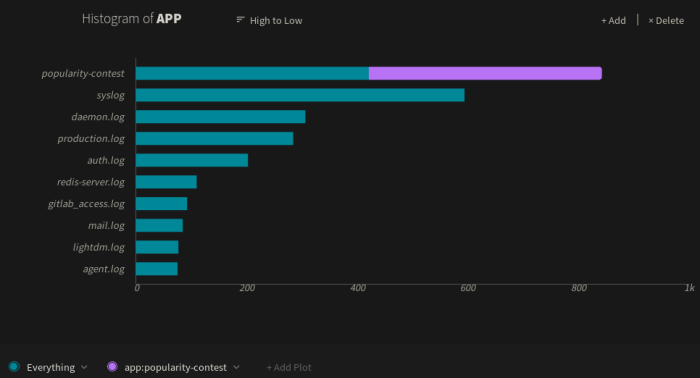
Histogram showing log volume compared across apps.
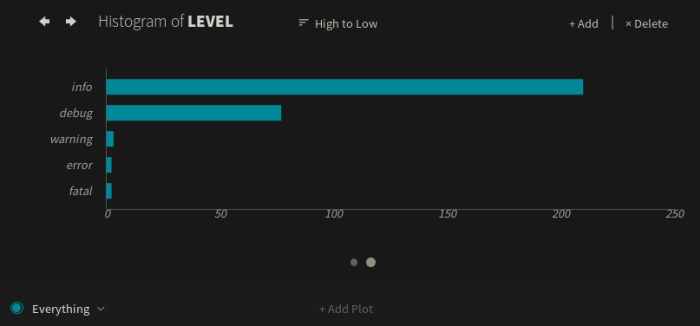
Histogram showing log volume by type
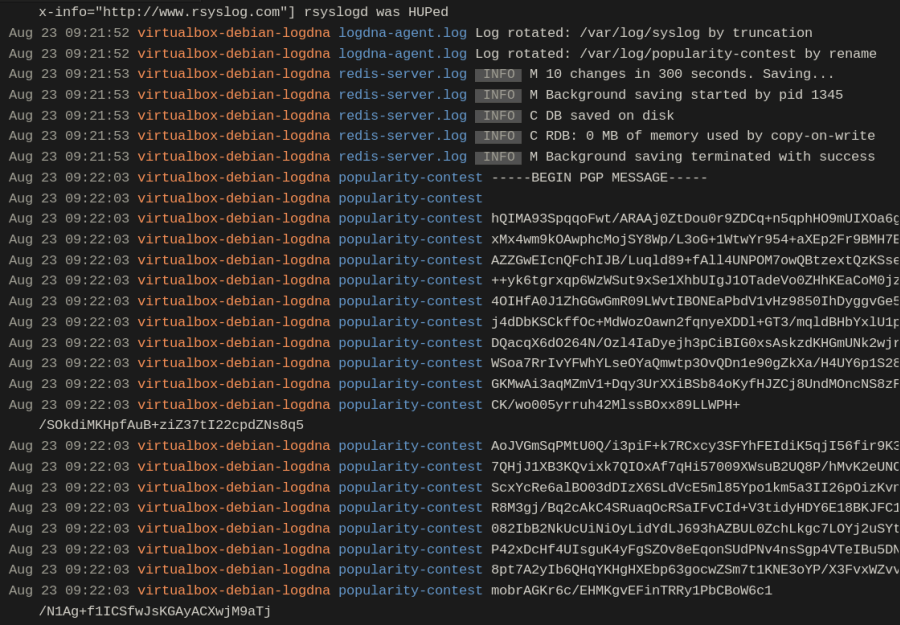
Log viewer showing logs from the service popularity-contest. These logs are related to the log spike.
Analyzing Changes in Performance
We can use visualization tools to track application performance metrics, including response times, response sizes, and request volumes. For example, our web application logs the size of each response in bytes. After the restart, the average response size started significantly higher than usual. Shortly after, the response size fell to a low and steady average.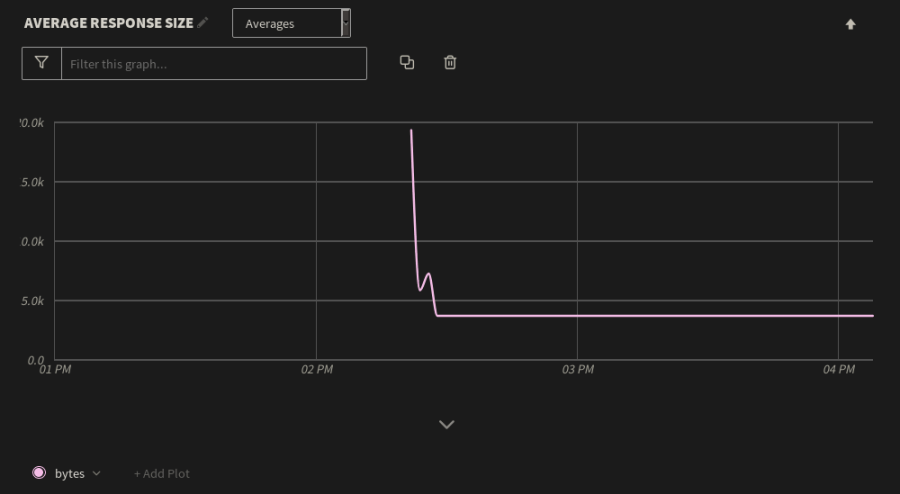
Average response time of a web application. There is a big spike, the normalizes.
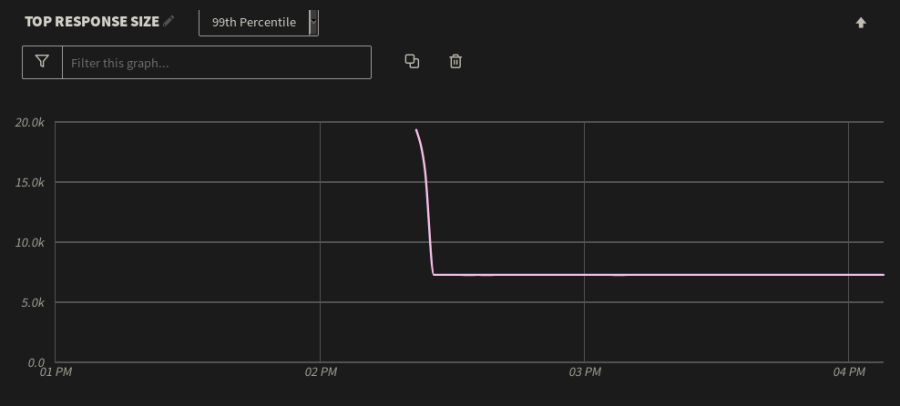
The web application spike is charted to the 99th percentile to display the top 1% of response sizes over the same period of time. The spike was not normal.