

Getting Started
Outside our Telemetry Pipeline docs, if you run into any issues or have feedback on either the workshop or Pipeline, please reach out to us at support@mezmo.com. Before beginning, you will need the following- A Mezmo account, sign up for a trial here.
- Docker
Overview
In this workshop, we will use the OpenTelemetry Demo to explore how to understand and optimize telemetry data to both improve its value in identifying and resolving application issues and reduce the cost associated with maintaining that data. To accomplish this we will:- Create a OpenTelemetry Log, Metric and Trace Shared Sources in Mezmo
- Configure OpenTelemetry collector with Mezmo Shared Source credentials
- Explore the OpenTelemetry Logs via Data Profiling
- Send log data to Mezmo Log Analysis
- Aggregate specific log patterns
- Parse custom Apache data
- Aggregate OpenTelemetry Metrics to lower fidelity
- Sample OpenTelemetry Traces
- Configure Pipelines to be Responsive (i.e., capture full fidelity when in an incident or deployment state)
Final Results
In the end, you are going to build four Pipelines that look like- Log Profiling Pipeline
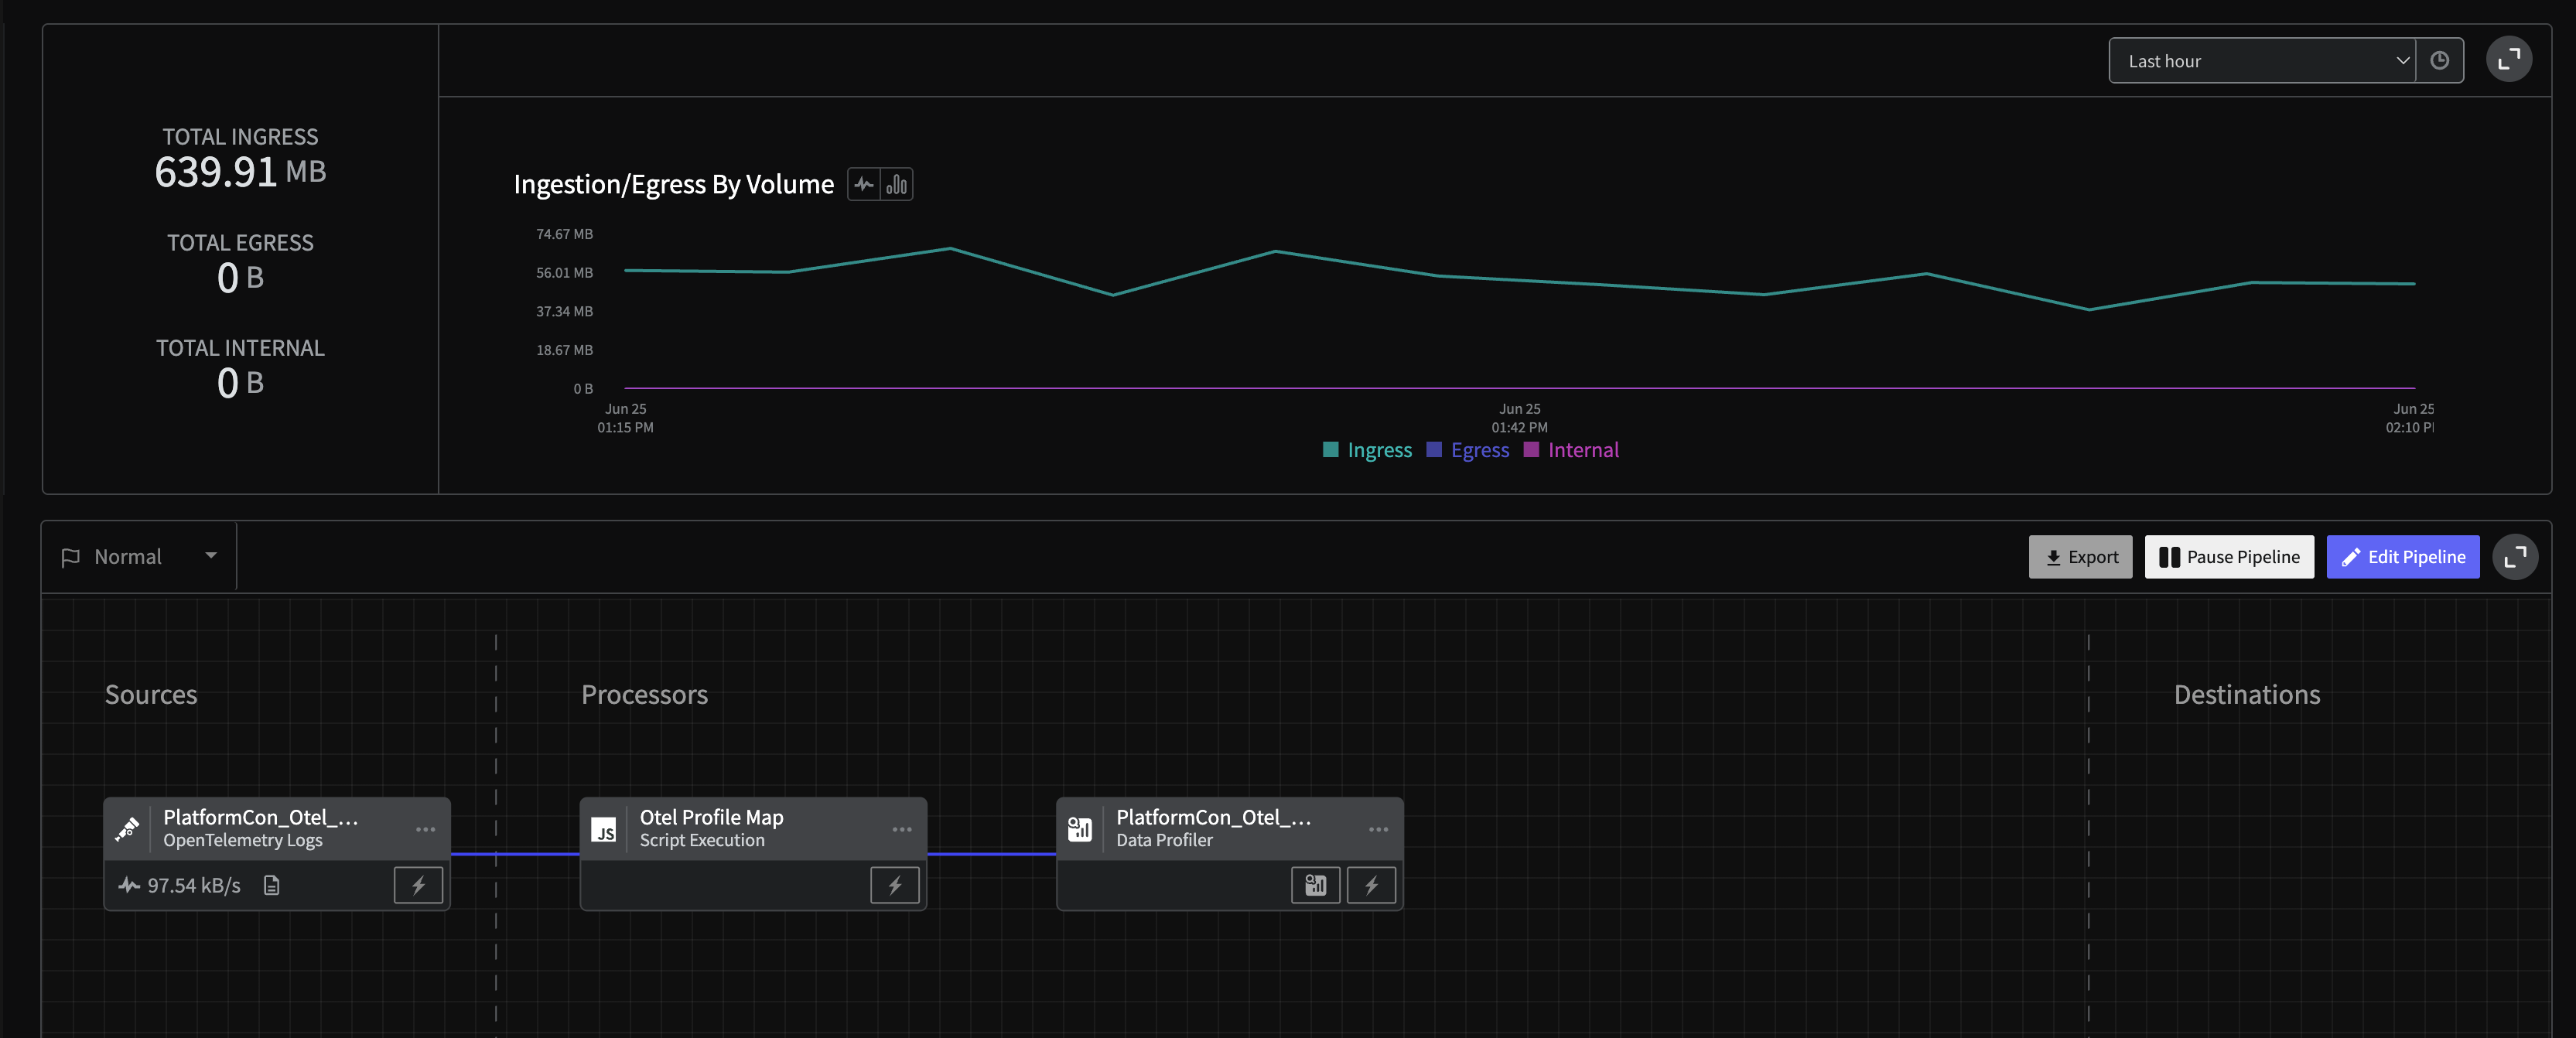
Final Pipeline: Log Exploration
- Log Handler Pipeline
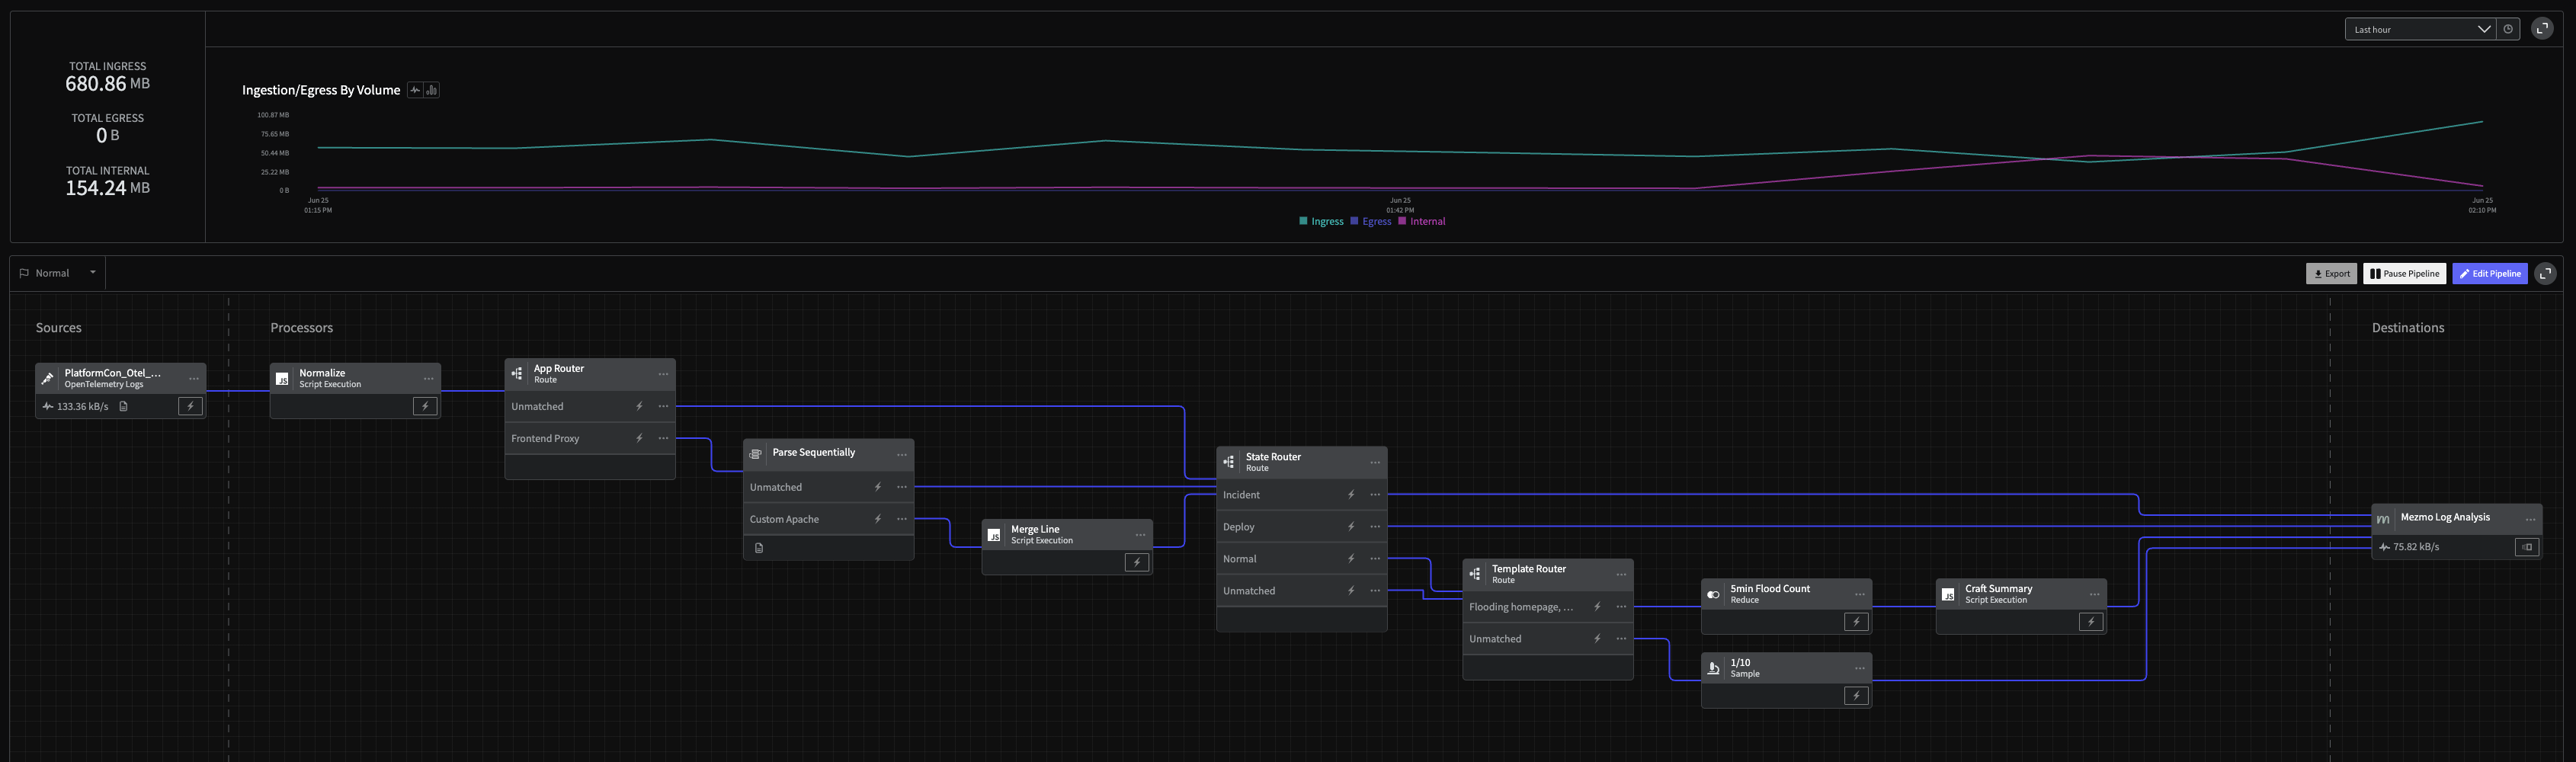
Final Pipeline: Log Handler
- Metric Handler Pipeline
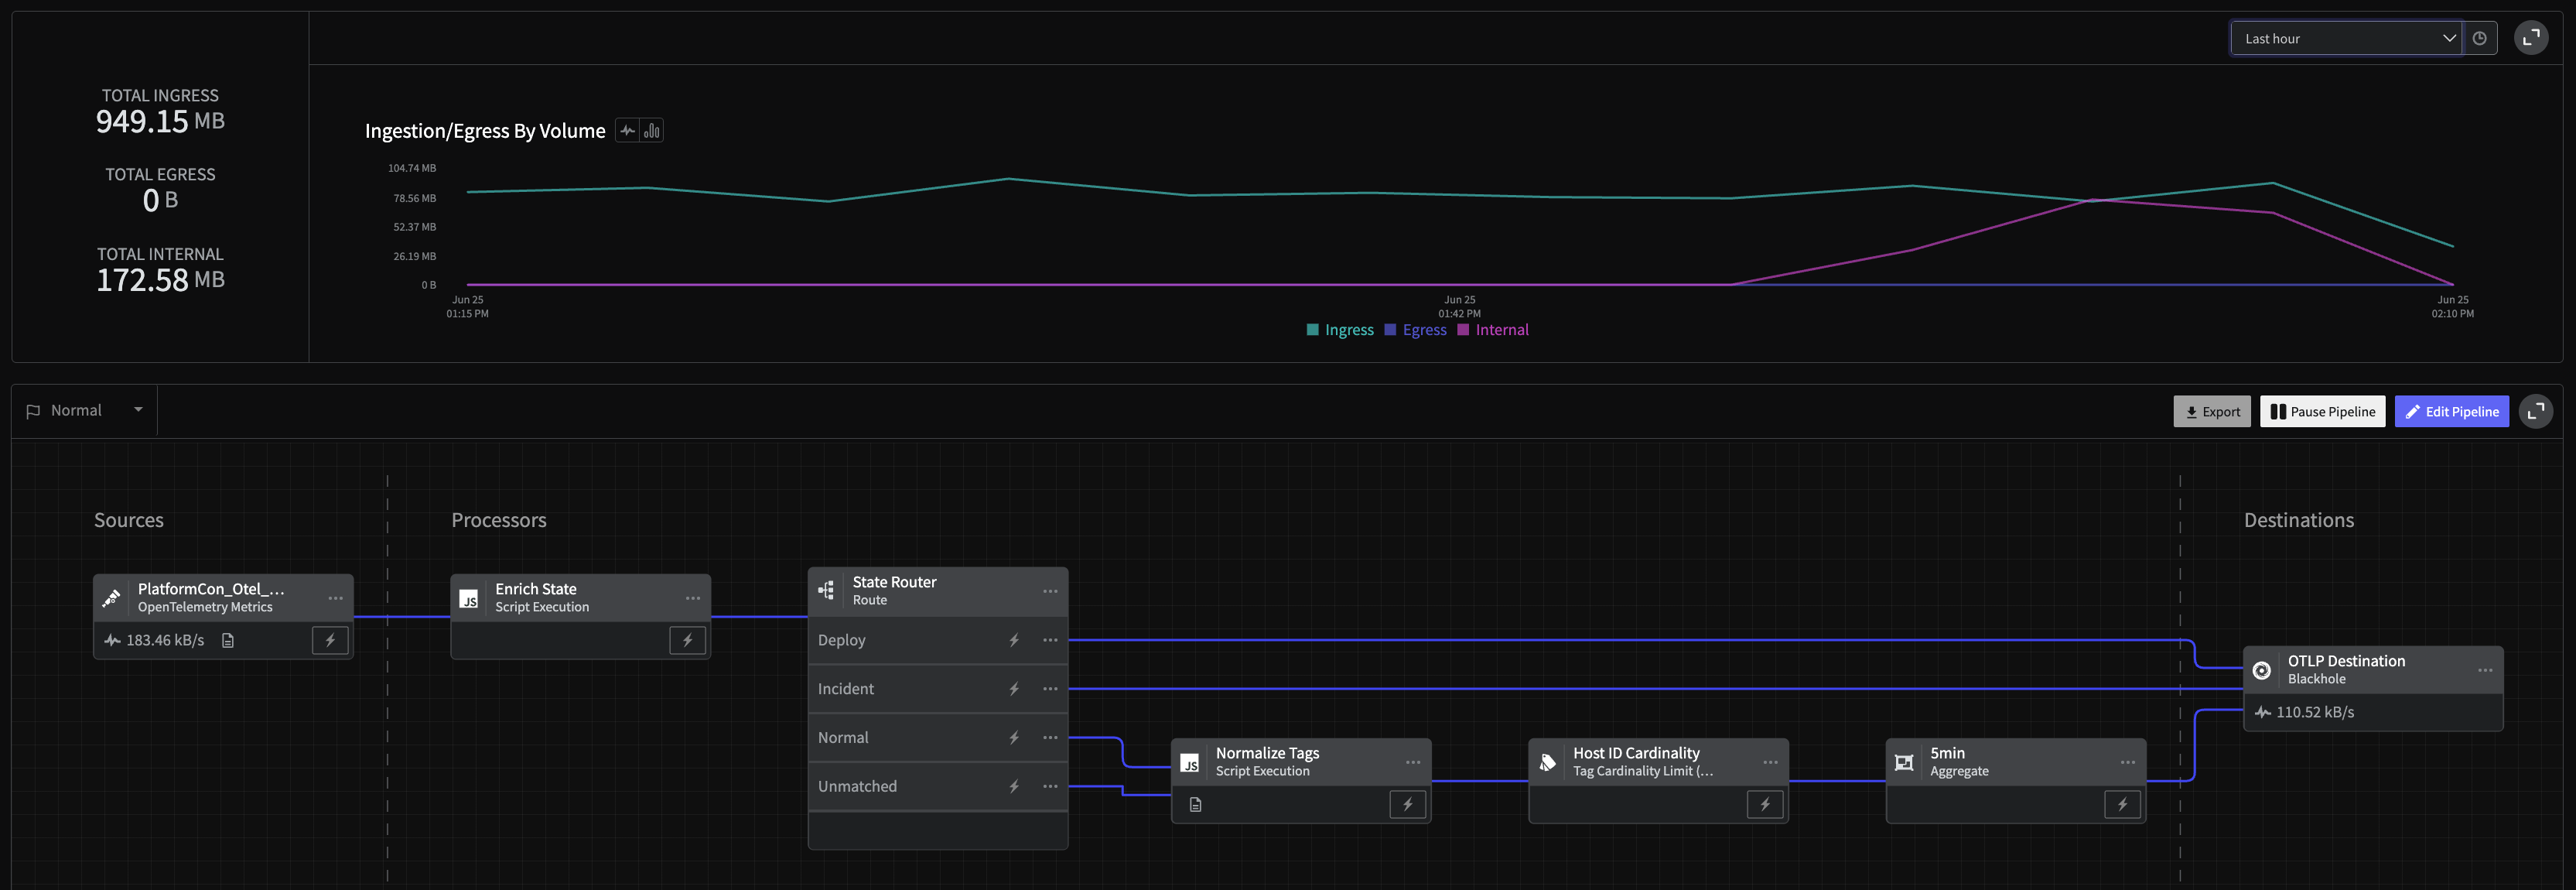
Final Pipeline: Metric Handler
- Trace Handler Pipeline
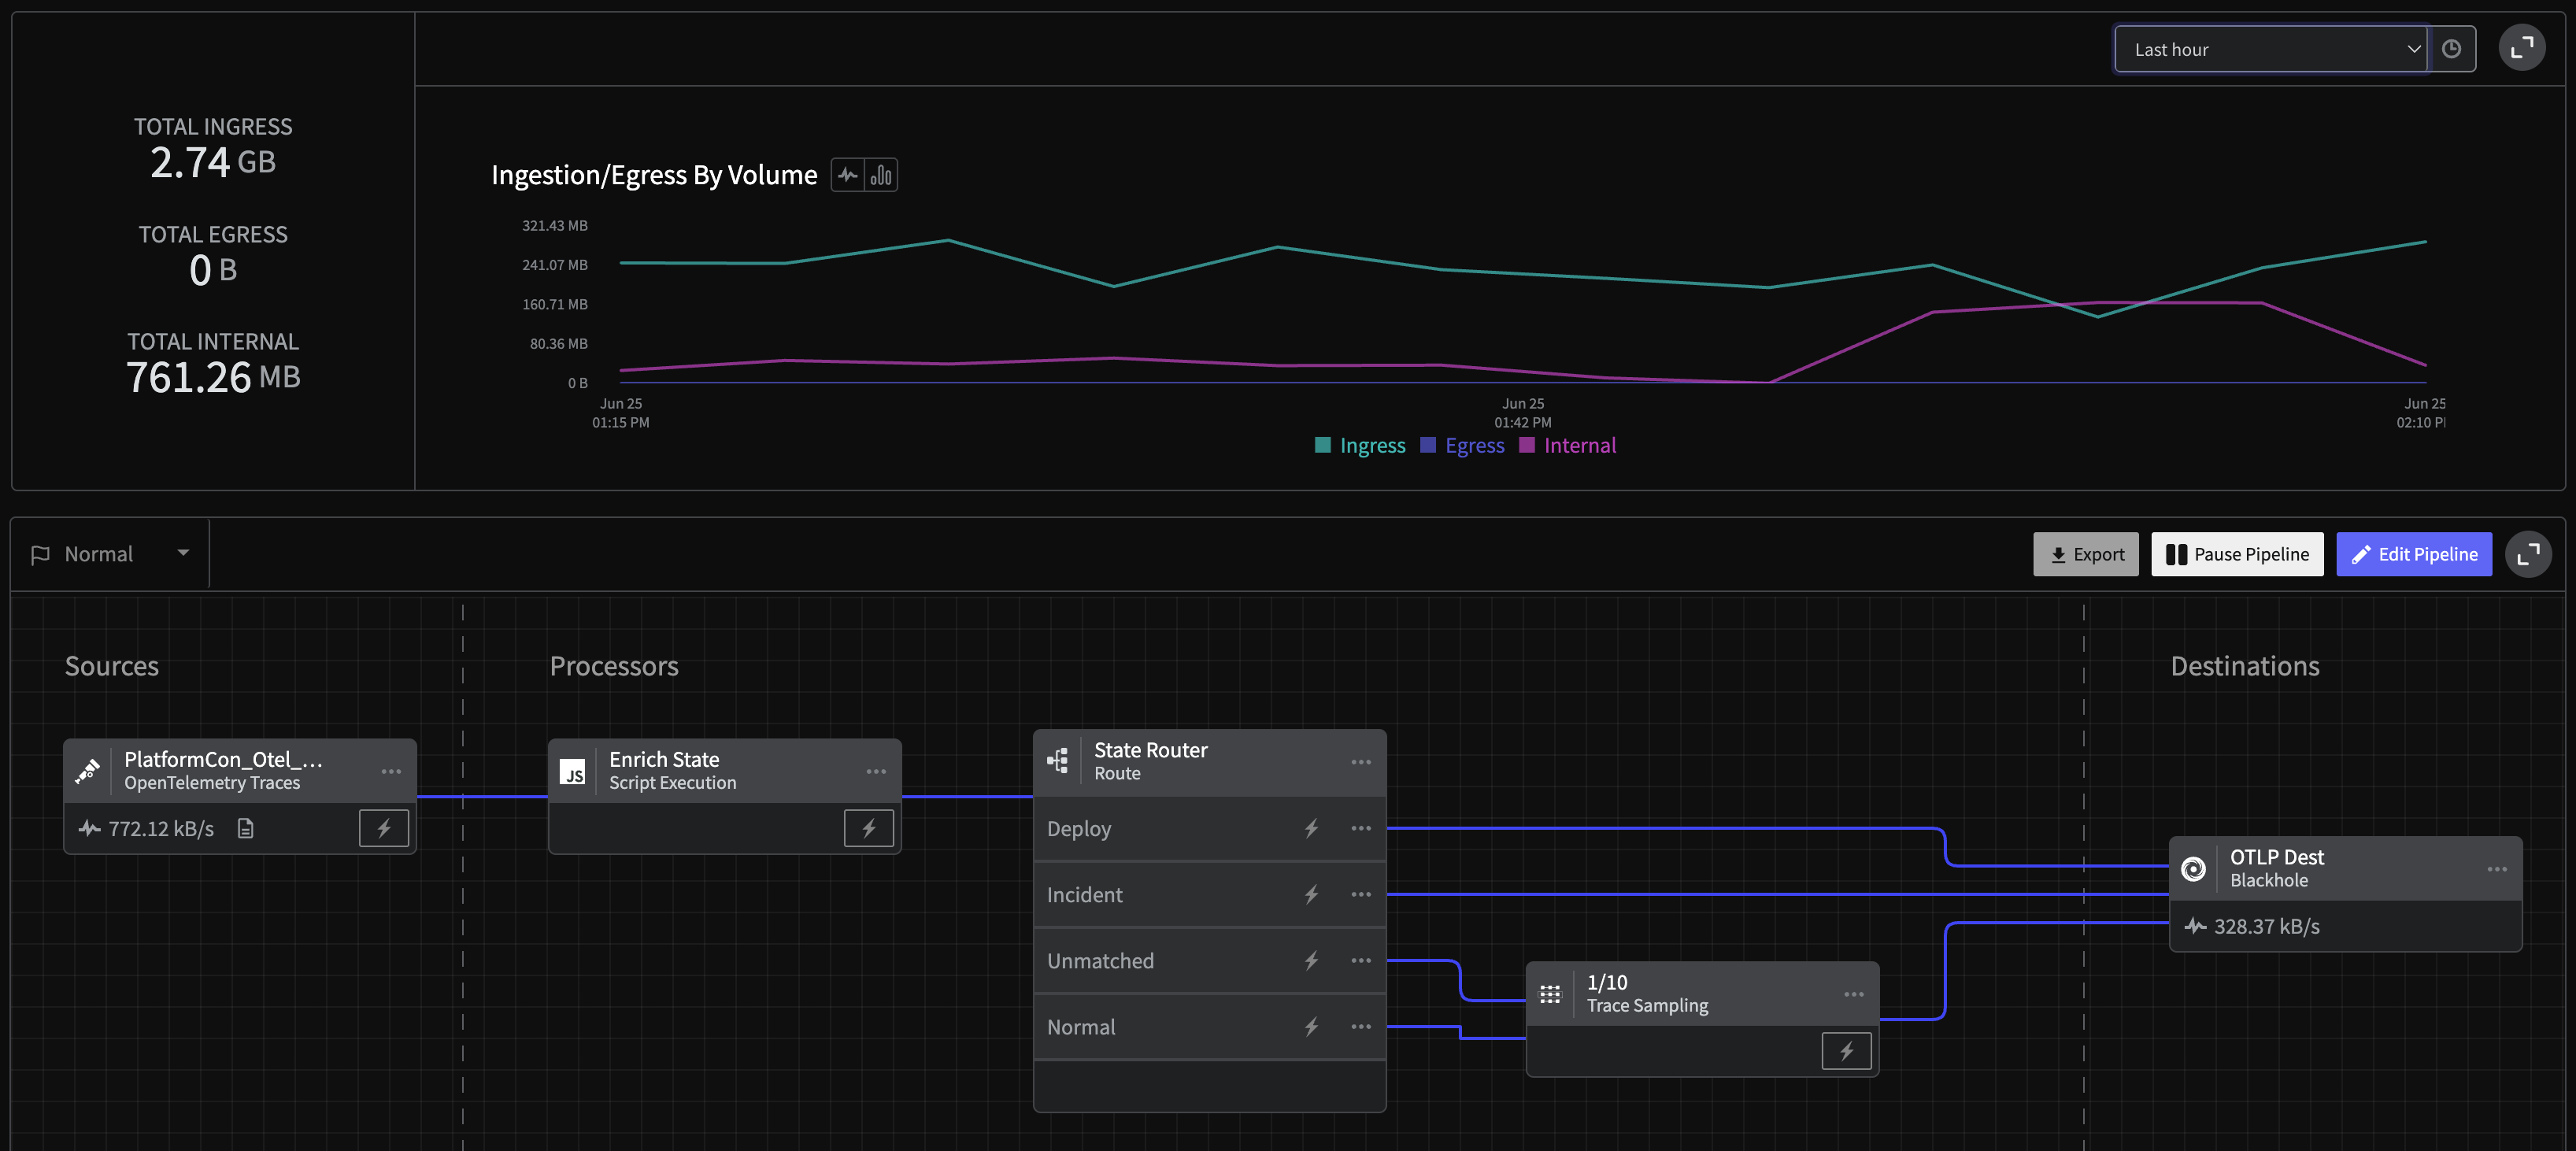
Final Pipeline: Trace Handler