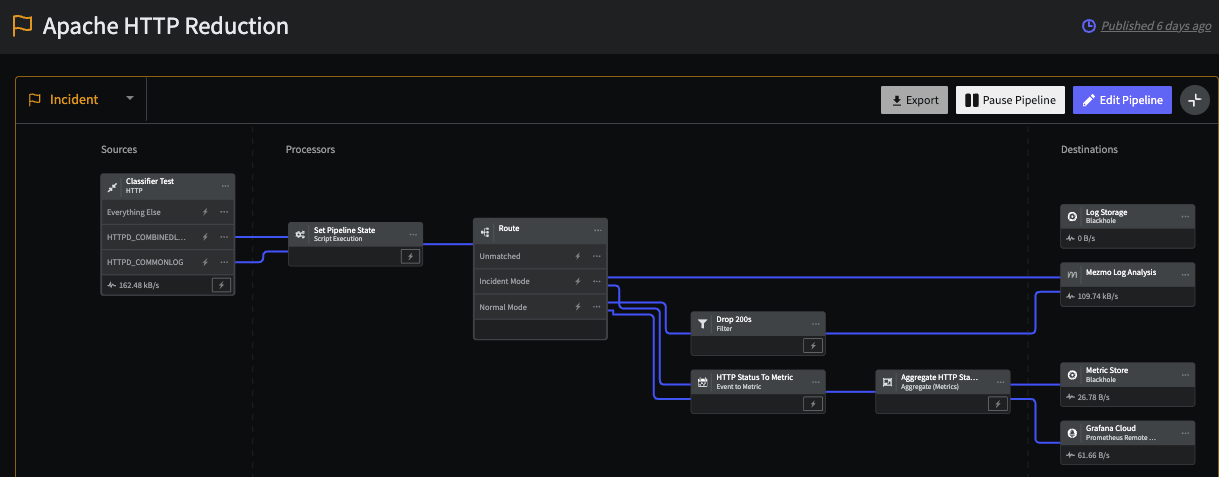
Status 200 events, and converts other HTTP Status events to metrics. In Incident Mode, the Route Processor sends the full data stream to Mezmo Log Analysis.
How it Works
Mezmo Responsive Pipelines introduces a state variableoperational_state that is associated with each Pipeline. The value for this state is either normalor incident, and the Processors in the Pipeline can change their functioning based on the value. For example, the Sample Processor can be disabled if operational_state=incident so that during the incident, you can have high fidelity data for further analysis.
Set the Pipeline Operational State
You can change the operational state of a Pipeline manually through the Mezmo Web App, or through the Telemetry Pipelines API.Mezmo Web App
You can change the operational state of a Pipeline in the Mezmo Web App by selecting the state in the upper-left corner of the Pipeline Map. The state of the Pipeline is also shown in the Pipeline name, with an orange flag indicating the Incident state.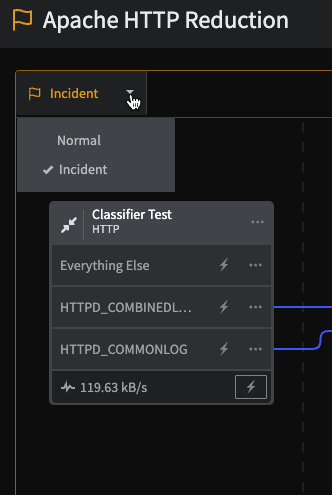
Changing the operational state of a Pipeline in the Mezmo Web App
You should change the state of a Pipeline in the Mezmo App at least once to initialize the Pipeline’s state table so it can be used with the API.
Use State Variables in Filter and Route Processors
Reference state variables directly in the Field property of Filter and Route processors using thestate.<variable_name> syntax. This lets you change processor behavior based on the pipeline’s operational state.
To route events based on the operational state, set the routing conditions as follows:
Script Execution Processor (Alternative)
Alternatively, you can use the Script Execution Processor to add the operational state as metadata to a message for more advanced use cases. This code shows how to get the Pipeline state variable and set it as message metadata: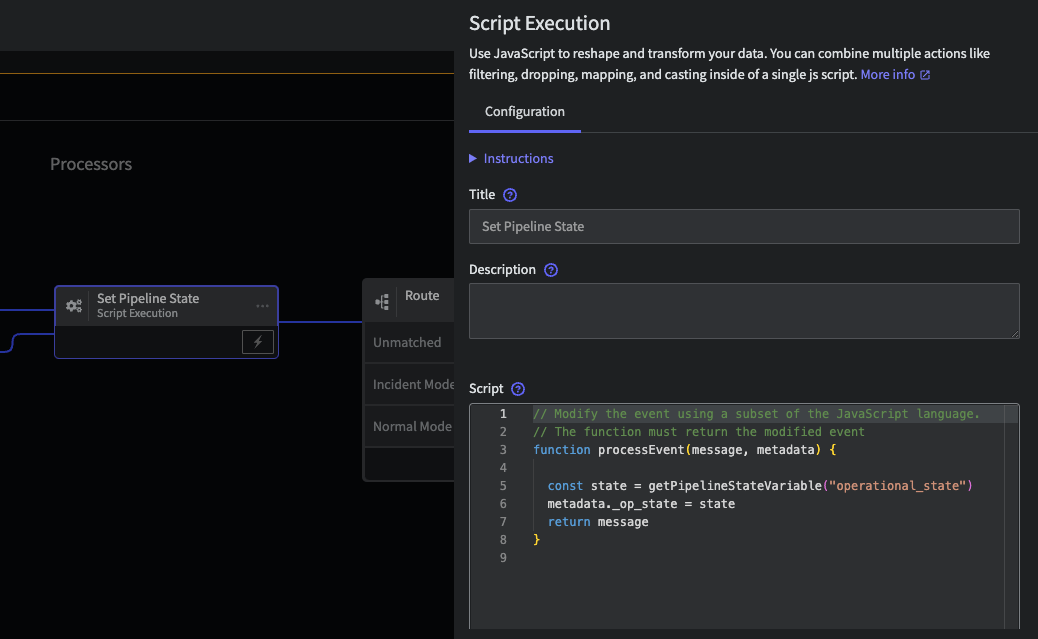
This screenshot shows the configuration of the Script Execution Processor to get the operational state and add it to the message
op_state in other processors:
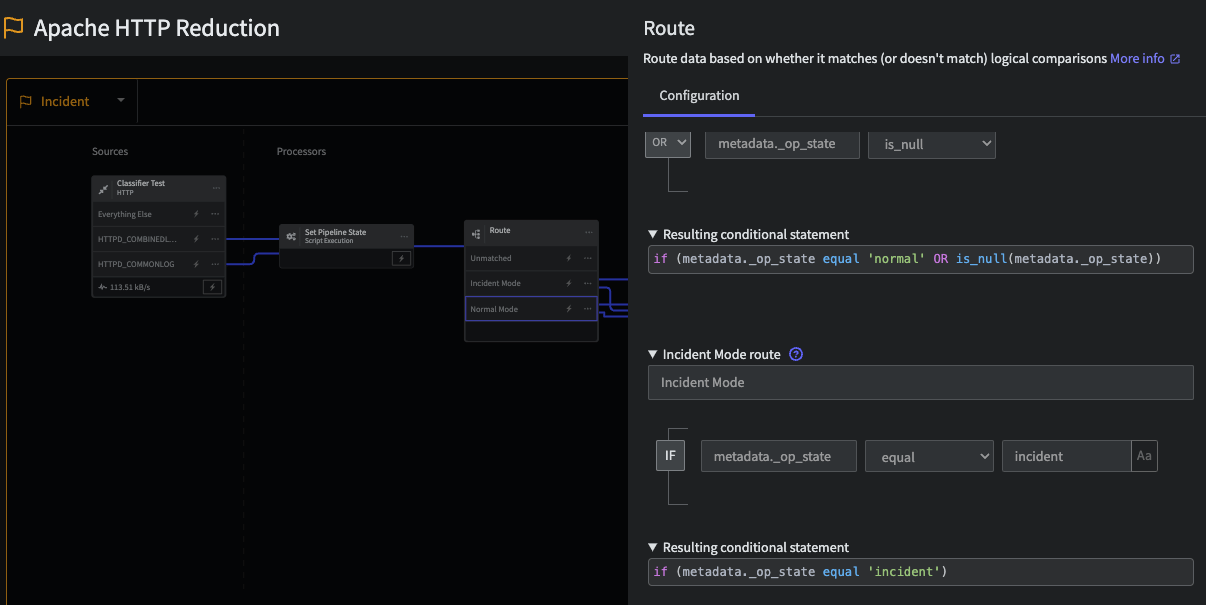
This screenshot shows the configuration of the conditions in the Route Processor for both Monitoring and Incident Modes
API
You can get and set the value of the Pipeline operational state with the Telemetry Pipelines API: Get thestate_id: