If you run into any issues or have feedback on either the workshop or Pipeline, please reach out to us at support@mezmo.com.
Pipeline Architecture
This schematic shows the architecture of the Pipeline you will create in this stop. The numbers in the schematic correspond to the step in the build process.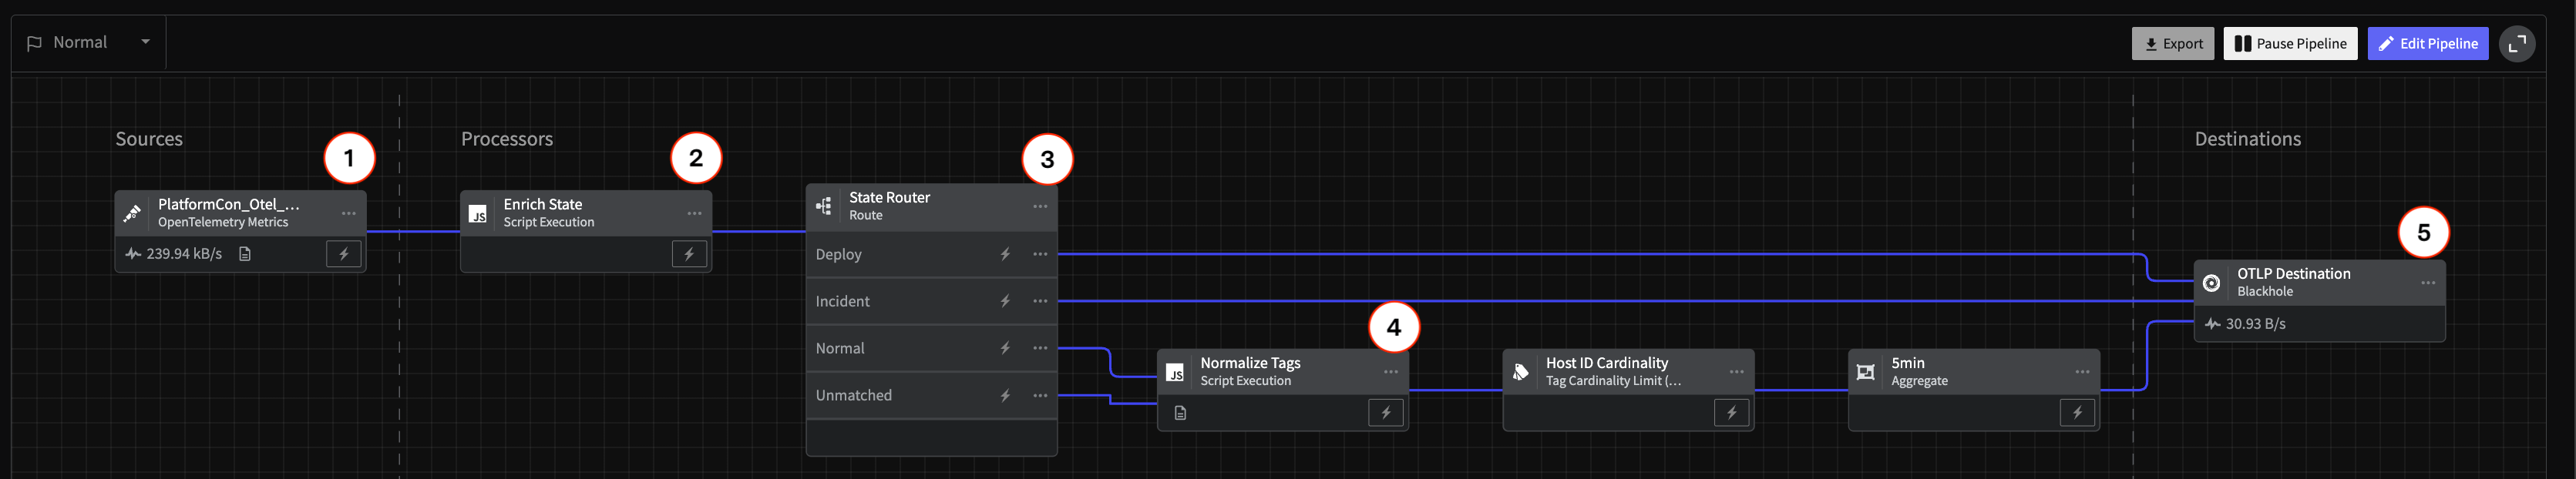
1 - Create the Pipeline and Add the Source
- In the Mezmo Web app, click New Pipeline and name it
Metric Handler. - In the Pipeline Map, click Add Source, then select the OpenTelemetry Metric source you created in Step 2.
2 - Add State Variables
A responsive pipeline changes its functioning based on detection of state changes. For this example, you will use the Script Execution Processor to add variables to the data that indicate the operational state of the pipeline.- Click the
...menu in the upper-right corner of the OpenTelemetry Metric source. - Select Add Node > Add Processor > Script Execution.
- Copy and paste this script into the Script field in the processor configuration panel, then click Save.
3 - Route Data Based on State
You can now set the Pipeline to route data basedon operational_state with the Route Processor.
- In the Pipeline Map, click Add Processor.
- Select Route Processor, and for Title, enter
State Router. - You will create three routes, one for the
Normalstate, one for theIncidentstate, and one for theDeploystate. After you configure the options for theNormalstate, click Add route to configure theIncidentandDeployroutes.
Normal Route Configuration
Incident State Configuration
Deploy State Configuration
4 - Create the Metric Data Optimization Processor Chain
In normal functioning, a common approach to reducing metric volume is to aggregate metrics and reduce tag cardinality. In this step, you will connect a Script Execution Processor, a Tag Cardinality Limit Processor, and an Aggregate Processor, in that order, to the normal and unmatched routes of the Route Processor.Script Execution Processor Configuration
- In the Pipeline Map, add a Script Execution Processor to the Pipeline, and connect it to both the unmatched and normal routes.
- Copy and paste this script into the processor configuration.
Tag Cardinality Limit Processor Configuration
This configuration will limit the number of tags for thehost_id field to 10.
- In the Pipeline Map, add a Tag Cardinality Limit Processor and connect it to the Script Execution Processor.
- Enter these configuration options for the processor.
Aggregate Processor Configuration
This configuration will aggregate metrics based on a five minute interval.- In the Pipeline Map, add an Aggregate Processor and connect it to the Tag Cardinality LImit Processor.
- Keep the default configuration settings, but set Interval (seconds) to
300.
5 - Add the Blackhole Destination
You can send your optimized data to any of Mezmo’s Supported Telemetry Data Destinations, but in this case, the route will terminate in a Blackhole destination that drops all data sent to it. This is useful for testing the data processing of your Pipeline before sending it to production destination.- In the Pipeline Map, click Add Destination.
- Select Blackhole, and connect it to the to outgoing routes of the Route Processor as shown in the pipeline architecture schematic.
Deploy the Pipeline
To activate the Pipeline, click Deploy.Initialize State and Get State ID
As you did with the Log Handler Pipeline, you need to initialize the state of the Pipeline and get theState ID of the pipeline for reference in Step 8.
- In the Pipeline Map, click on the State setting in the upper-left corner, and change it to
Incident. - Change the State setting back to
Normal. This will initialize the Normal state, and generate thePipeline_IDfor the pipelinestate-variable. - In a terminal, run this command with the
pipeline's ID and grab that State ID.