If you run into any issues or have feedback on either the workshop or Pipeline, please reach out to us at support@mezmo.com.
Create a Log Explorer Pipeline
- In the Mezmo Web App, go to Pipelines and click New Pipeline.
- Select Create a blank pipeline.
- For Pipeline Name, enter
Log Explorer. - Under Deployment Options, select SaaS.
- Under Select a path, select Create a blank pipeline.
- Click Continue.
Add the OpenTelemtry Log Source
- In the Pipeline Map, click Add Source.
- Under Shared Sources, select the OTel Log Source.
- Click Save. The Source will be added to the Pipeline Map.
Add the OTel Mapping Script
This script will map OTel fields to a format for the Data Profiler to analyze.- In the Profile Map, click Add Processor.
- Select Script Execution.
- Copy and paste this script into the Script field.
- Click Save.
- Connect the Source to the Script Execution Processor.
Add a Data Profiler Processor
- In the Pipeline Map, click Add Processor.
- Select Data Profiler, and give it the name
OTel Demo Log Exploration. - Click Save.
- Connect the Script Execution Processor to the Data Profiler Processor.
Deploy the Pipeline and View the Data Profile
In the Pipeline Map, click Deploy Pipeline to activate the Pipeline. The Data Profiler will begin to run, and after a few minutes you will see a Data Profile similar to this: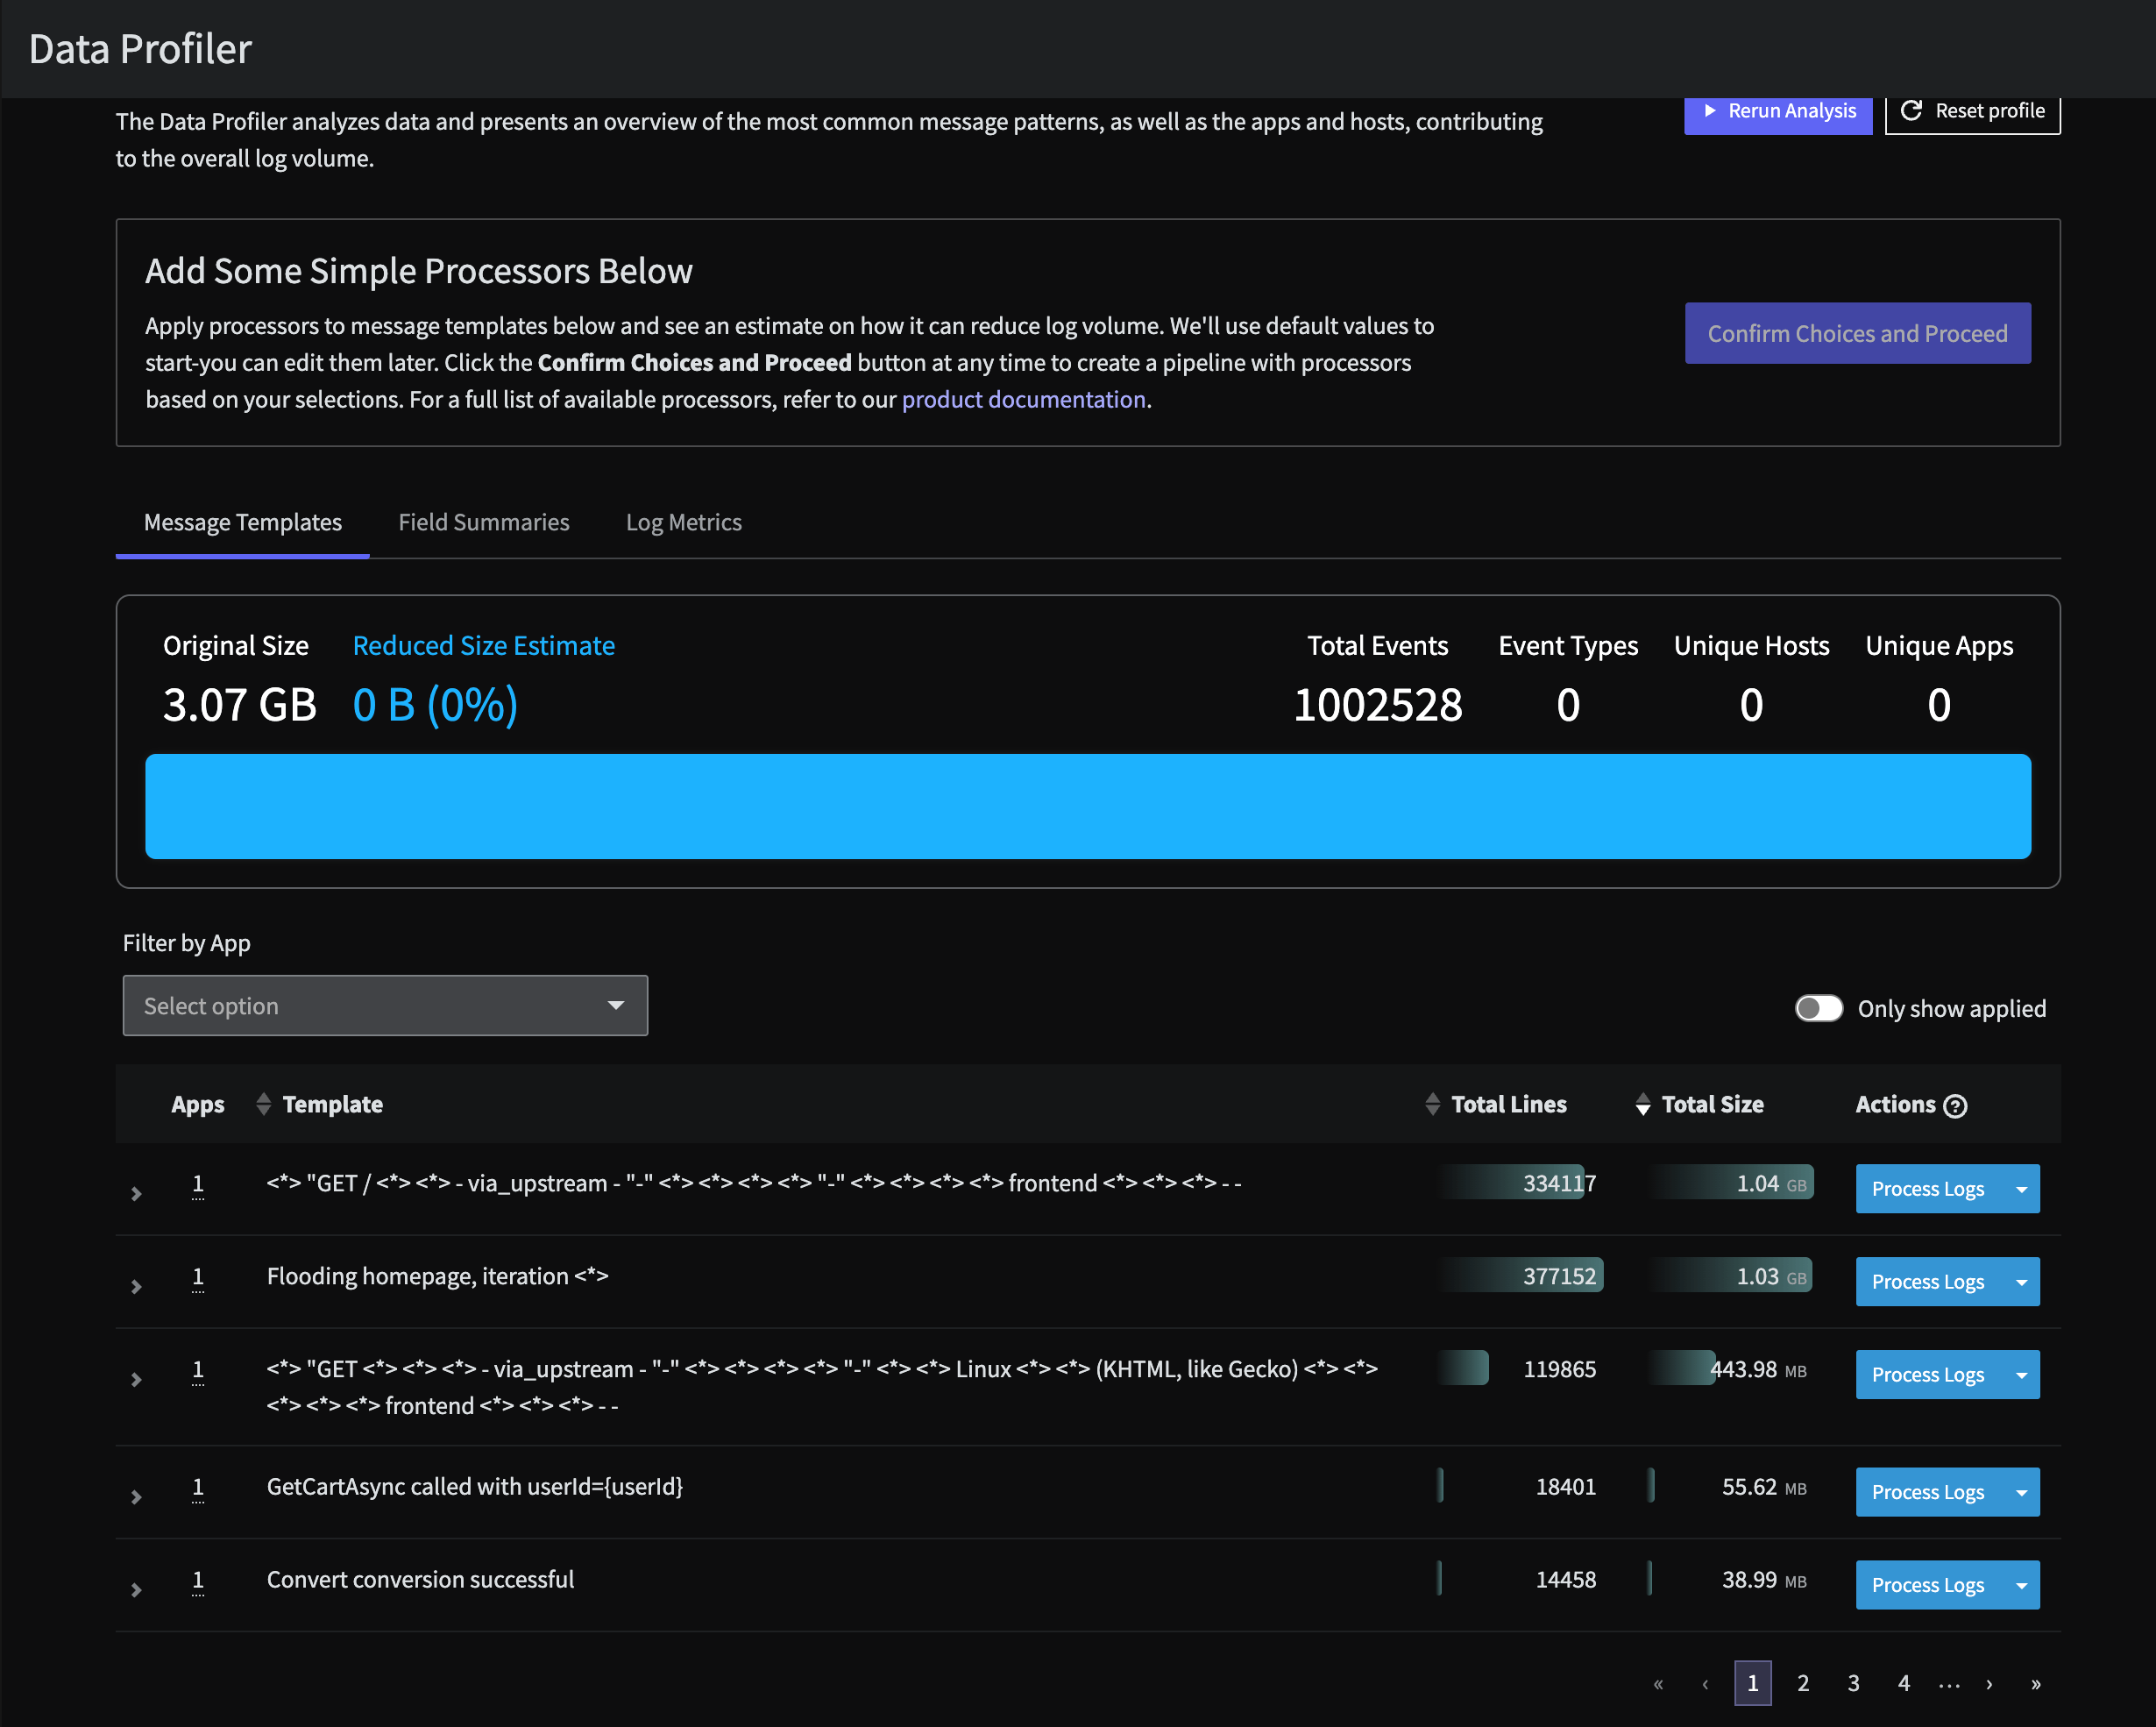
- The
load-generatorservice is sending a huge volume of logs simply stating a homepage is being flooded. This is standard behavior of the OpenTelemetry Demo using the Feature Flag: loadgeneratorFloodHomepage , but this data is noisy and costly to retain.
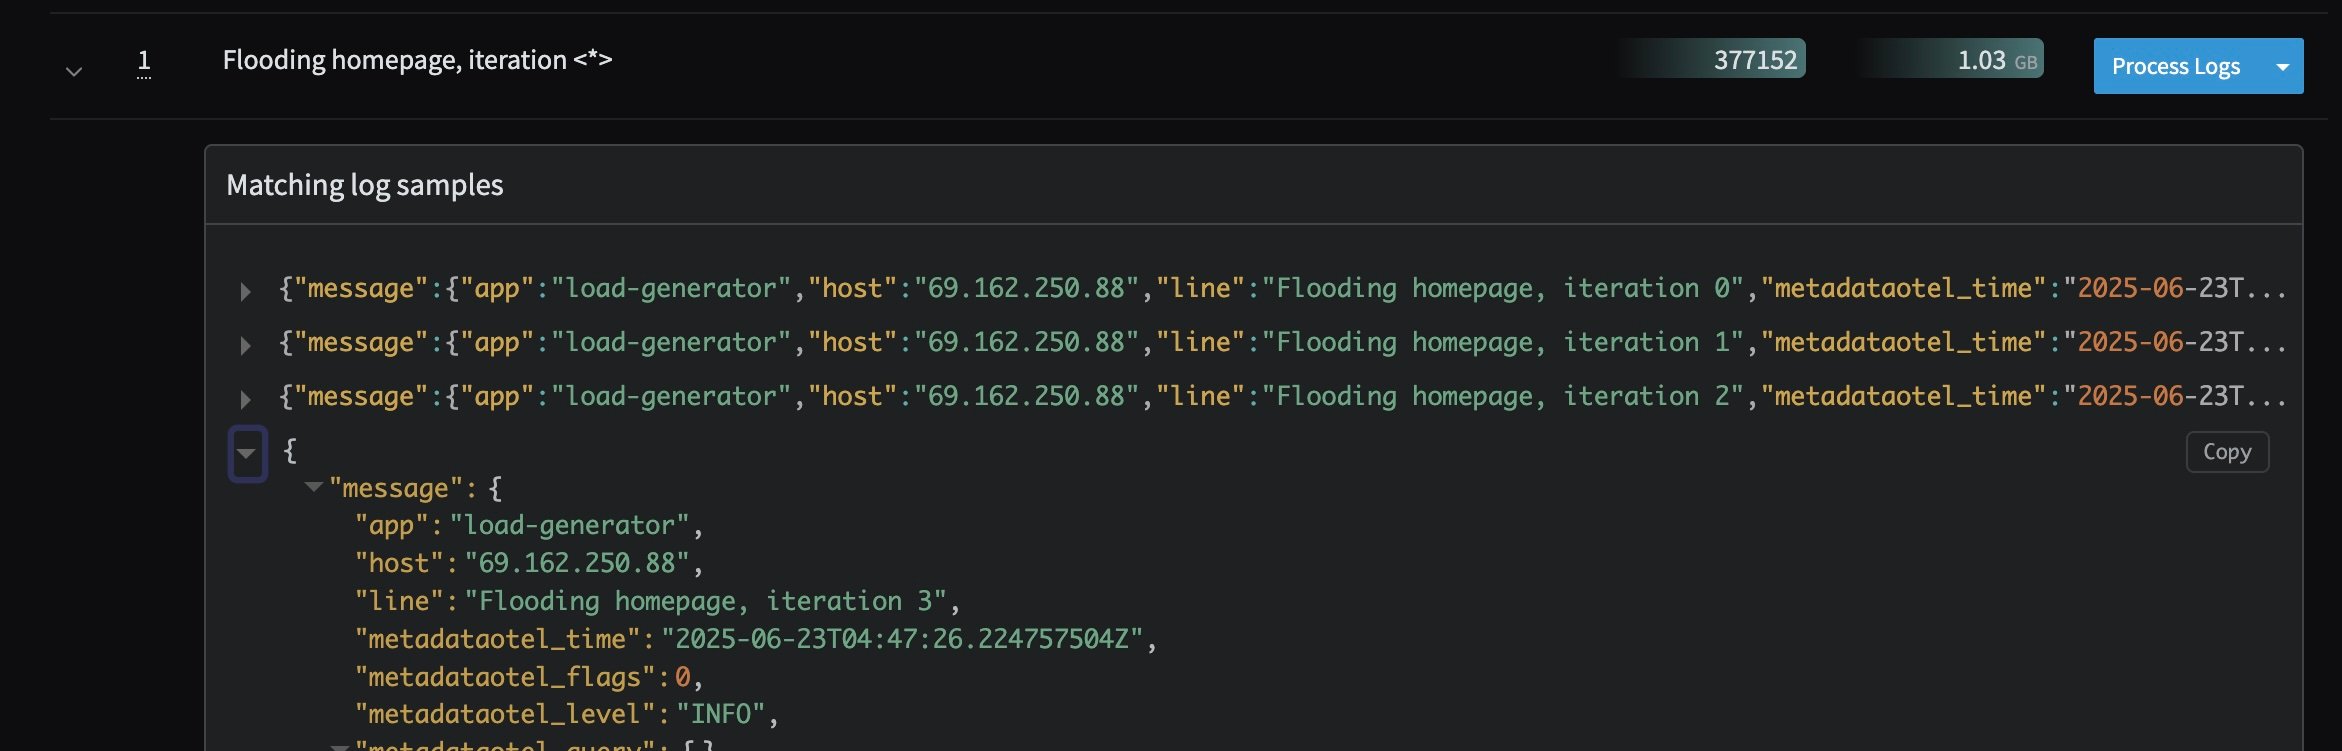
Homepage Flood Log Profile
- There are unparsed events that appear to be custom Apache logs being sent from the
frontend-proxyservice. While these are defined in the demo code here, we can take steps to make sure this data is structured and parsed properly to be searchable in any downstream Observability system.
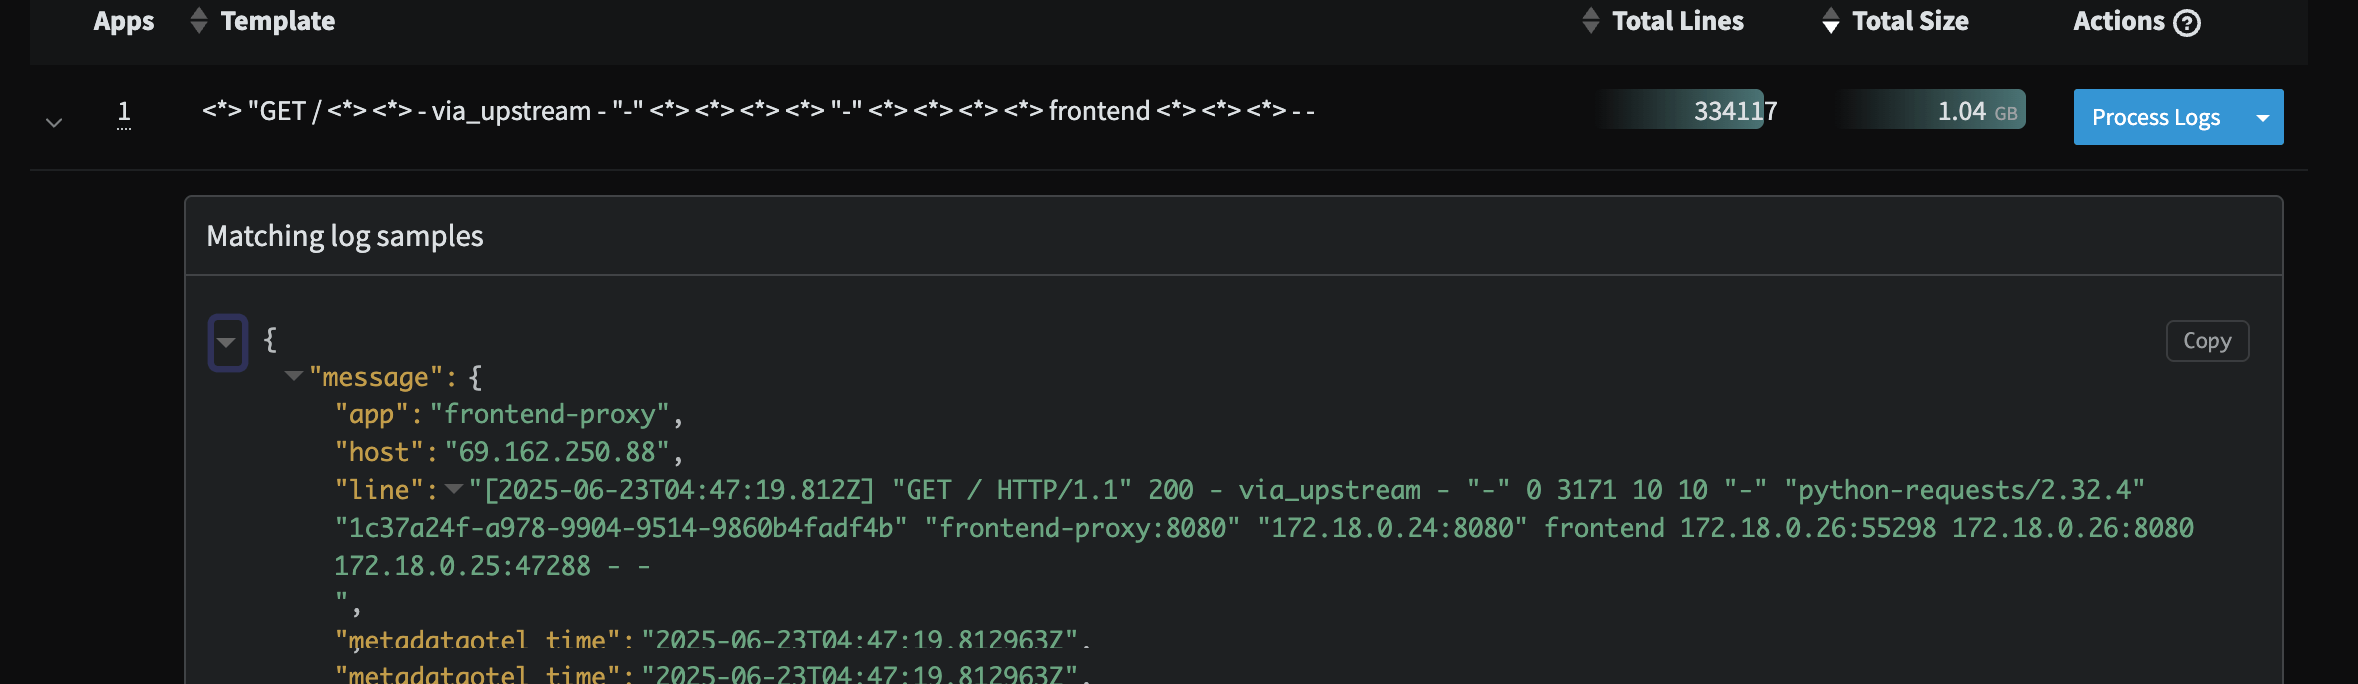
Custom Apache Profile