This processor is only available in Mezmo Cloud Pipelines.
Description
The Data Profiling Processor analyzes Source data and presents an overview of the most common message patterns, as well as the apps and hosts, contributing to the overall log volume.Use
A Data Profiling Processor is automatically added to your Pipeline as part of the Mezmo Flow process, but can also be added to a Pipeline as an independent component. Typically you connect all your source data to a Profiler so that it can analyze all the data. For the Data Profiler to work effectively, it needs to know which fields in the log line correspond to aHost, App, Label or Level. The Data Profiler provides configuration options to map these fields. This mapping mechanism may not work for all log formats. If the log format is drastically different and these fields cannot be mapped using the Data Profiler configuration, you can use a Map Fields Processor for example, to reshape the logs so the Data Profiler can process and categorize the log patterns correctly. In this case, you should add the Profiler processor after the Map Fields Processor in the Pipeline, or after any processors meant to transform the logs.
If you make changes to your upstream Source or any of the Processor configurations, you can then use the Data Profiling Processor to re-analyze the data and generate a new profile.
Once you have applied Processors to the log data in the profile and generated a Pipeline, the Actions for that profile will be disabled, and you will not be able to change the applied Processors. If you want to generate a new Pipeline, run the Profiler again, and apply Processors as necessary.
Profiler will run its analysis until it reaches 1M lines or has run for 24 hours.
Configuration
The Data Profiling Processor analyzes your log data and categorizes the discovered log patterns based onApp, Host, Label or Level field values. This helps you to understand which Apps contributed to a log pattern. However, different source logs can have different names for these fields. For example, some sources may have and App field while other sources may have a Service field to indicate the App or Service. Similarly, some logs may have a Line field, while other sources may have a Message field.
You can configure the Data Profiler to normalize the paths for your app and host names, as well as log levels and lines, as shown in these configuration options. The Profiler looks for the existence of any of these fields to normalize the data for analysis.
View the Data Profile
Once a Data Profile has been generated for the Source, you can access it through both the Processor itself, and the navigation in the Mezmo Web App. Check out Create a Data Profile for more information on the reports created for the profile. If you want to generate a new data profile for the Processor, access the current data profile, then click Reset Profile. The Data Profiler will then run a new analysis of your log data. If you run the Data Profiler multiple times without resetting, any new log templates that are discovered will be added to the existing report.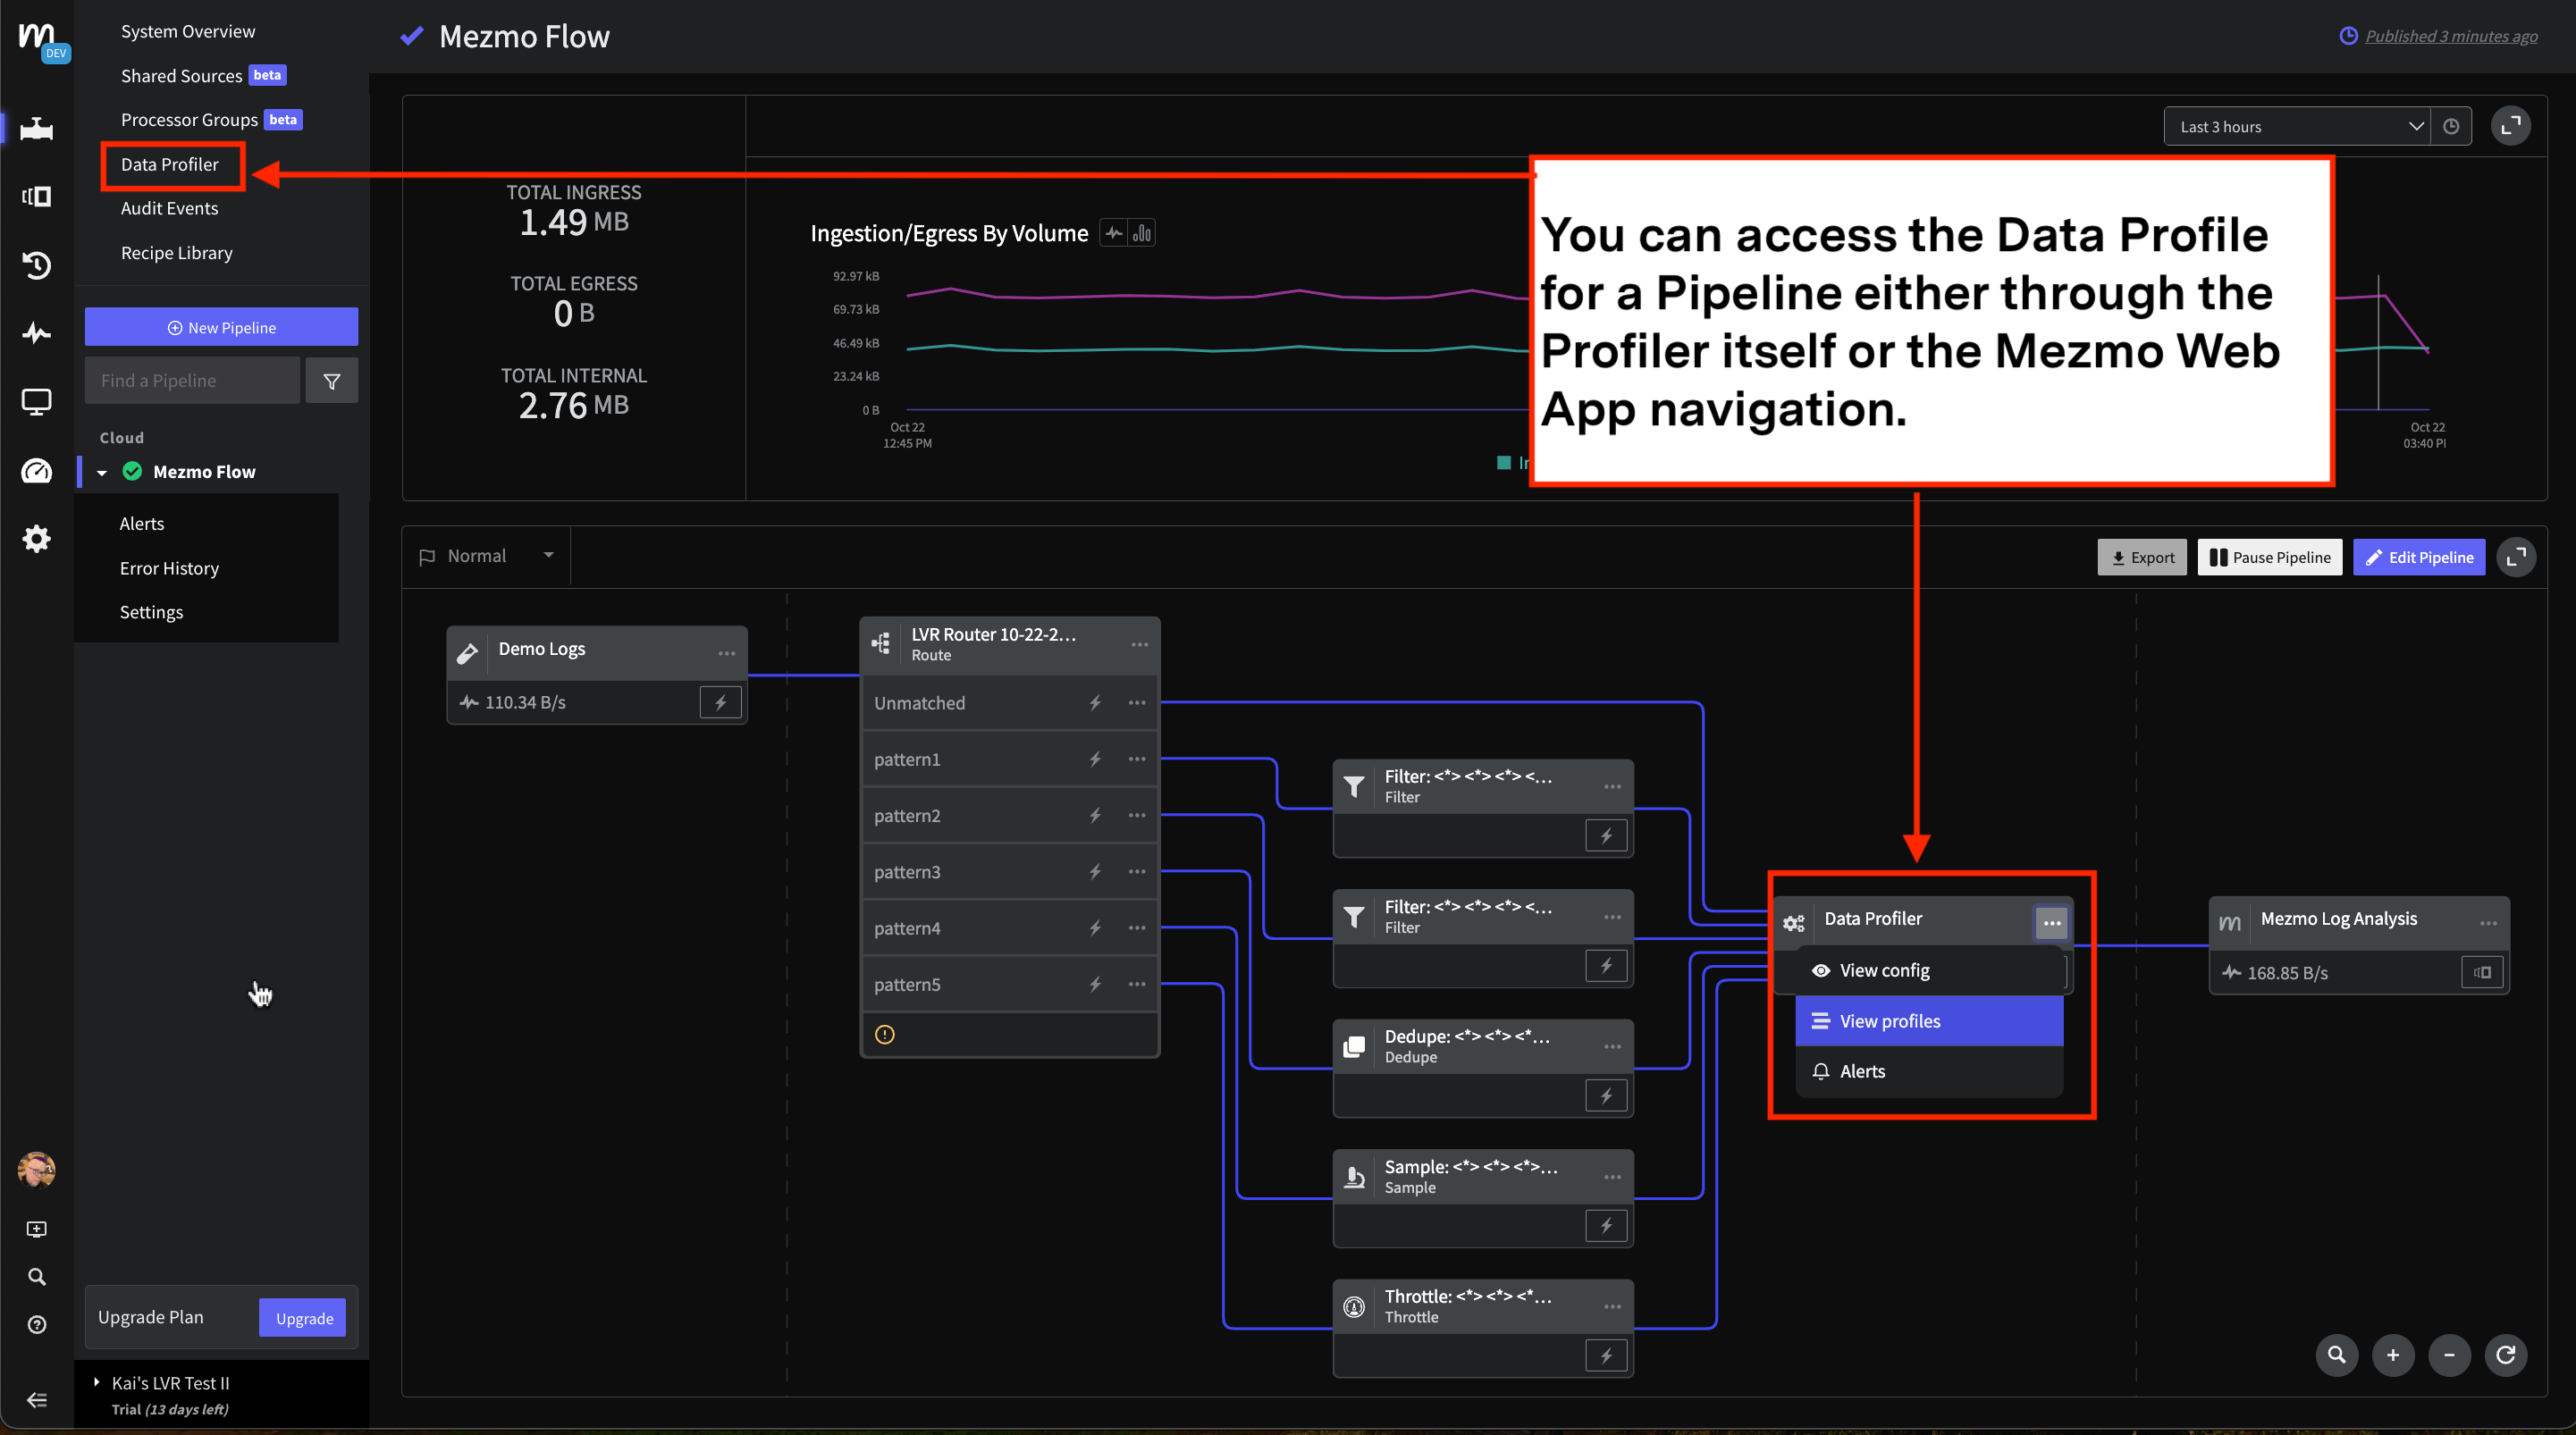
This screenshot shows how to access the Data Profile for a Pipeline through both the Processor and the navigation in the Mezmo Web App.