If you run into any issues or have feedback on either the workshop or Pipeline, please reach out to us at support@mezmo.com.
Why It Matters
Telemetry data is both fundamental and costly for any business. While this data is invaluable for troubleshooting, monitoring and various other concerns, it is not always valuable at the same time. Mezmo introduced Responsive Pipelines specifically to address the dynamic nature of telemetry data. By allowing for extreme configurability, telemetry flows can be tuned for changing circumstances from incidents to deployments.1 - Modify Responsive Test script
Using the State ID’s for your Log, Metric and Trace pipelines modifyswitch_state.sh with the proper credentials.
2 - Run Responsive Test Script
Now let’s run the script with your desired state to initiate Mezmo Pipeline flow changes. For instance, to flip to Incident mode you would run:3 - Evaluate Impact
Notice that when inNormal mode, data in your pipelines are sampled and rolled up ensuring the needed signals are captured while remaining cost conscious. However, when in Incident or Deployment modes, data is grabbed at full fidelity. You will also see this represented in the Mezmo Web App.
Normal Mode
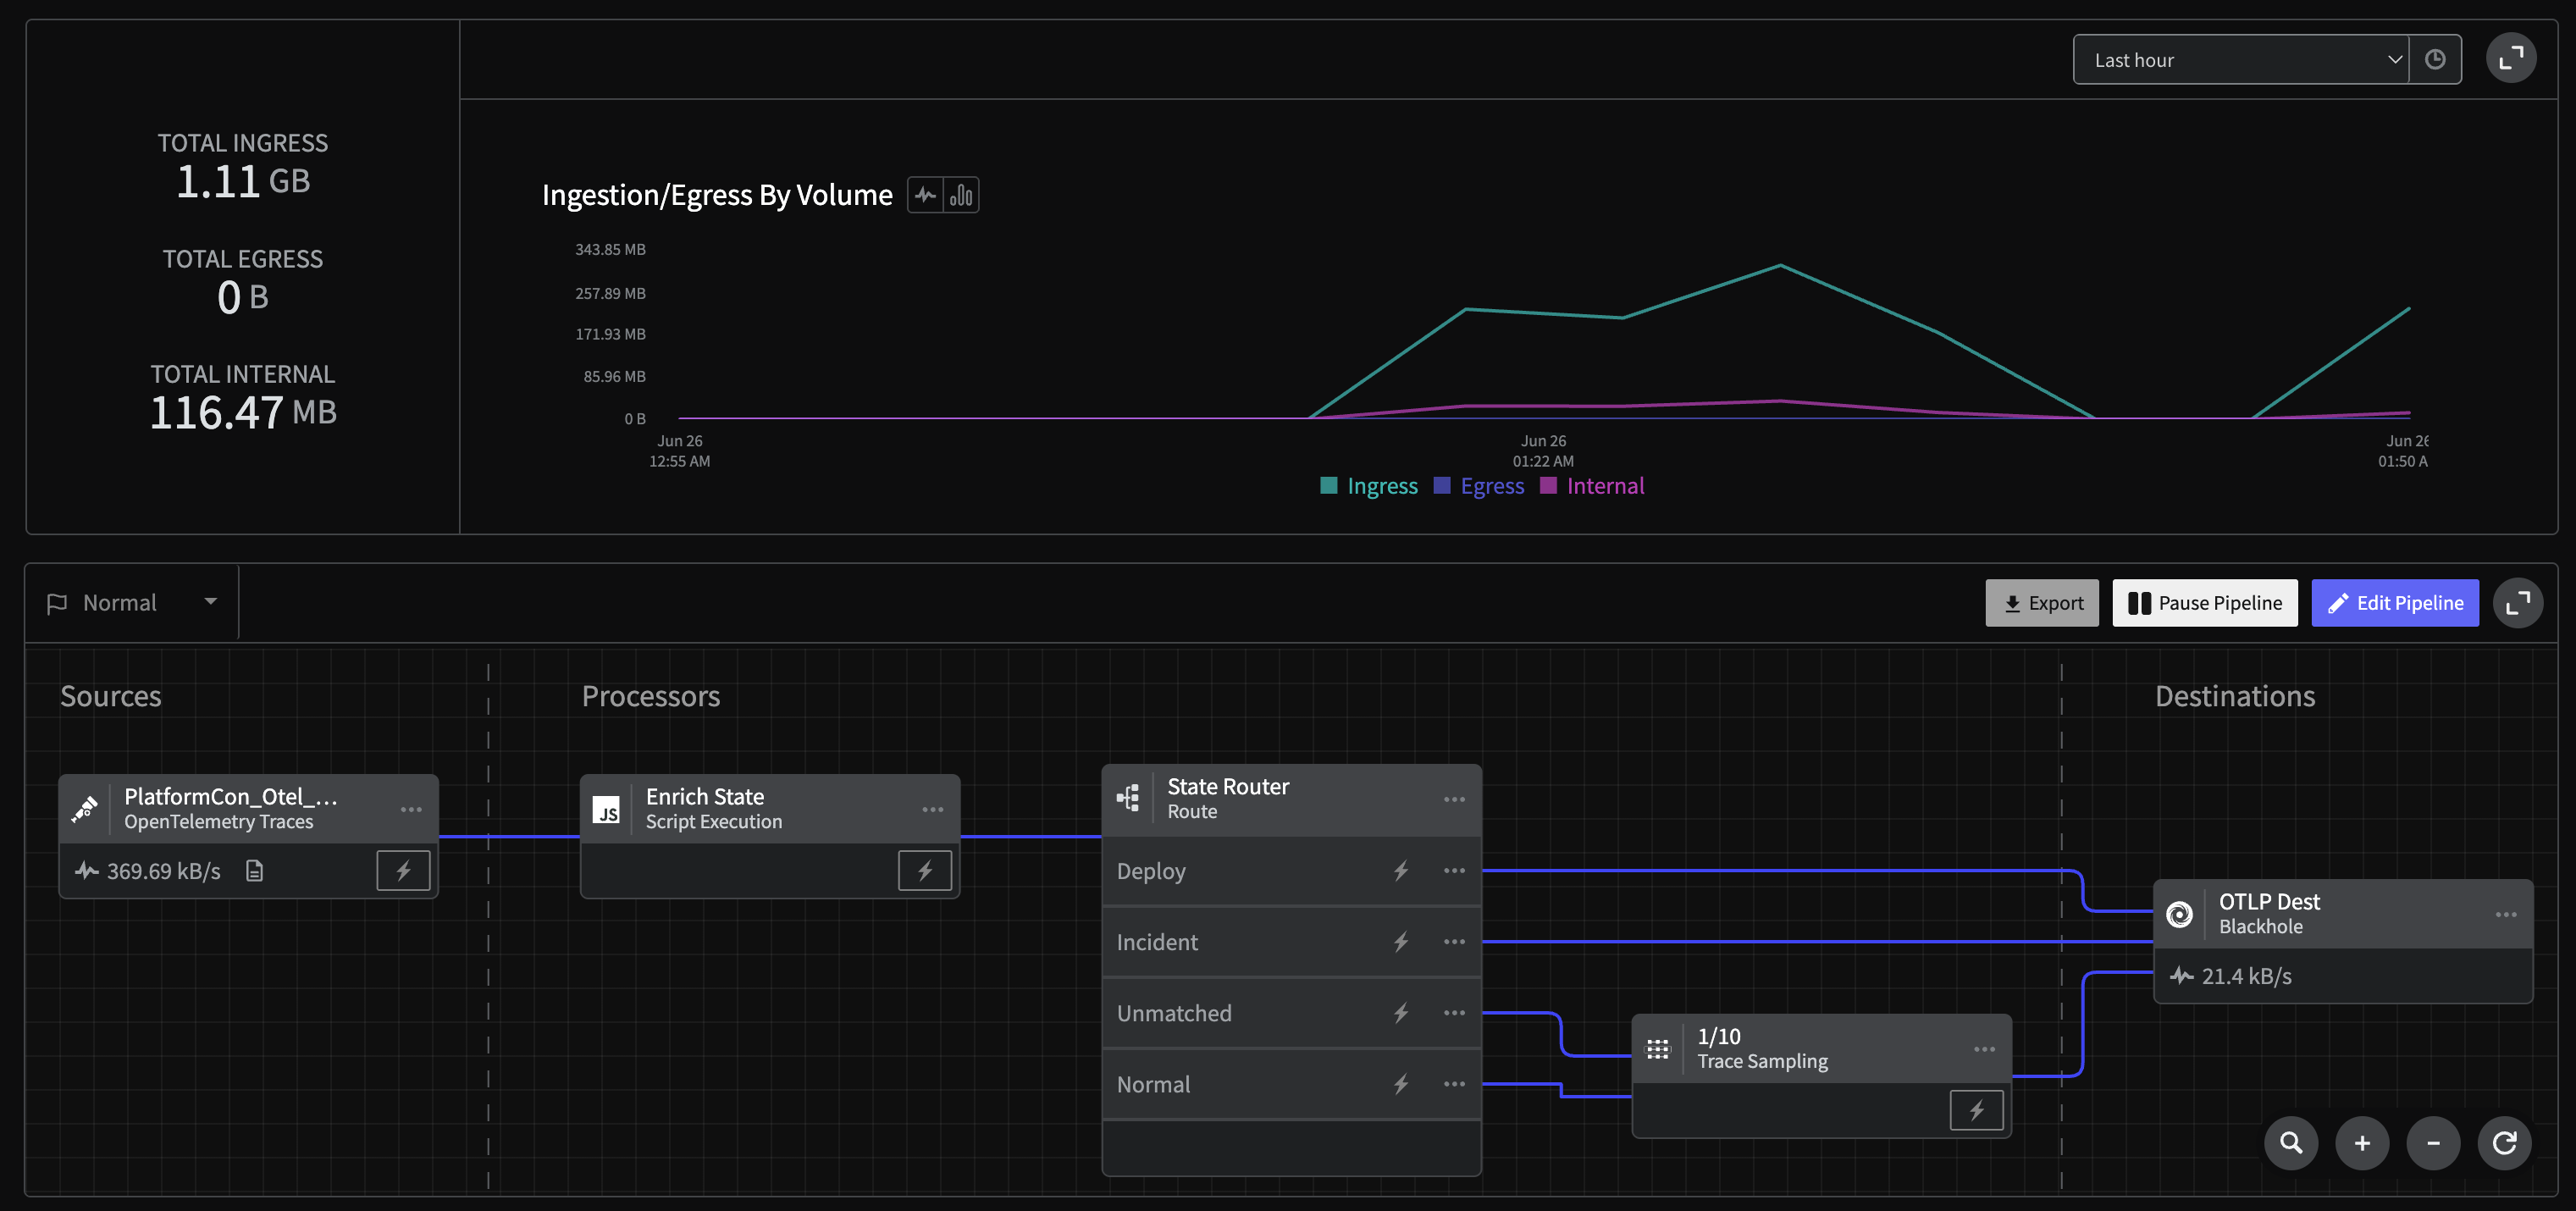
Normal Mode
Incident Mode
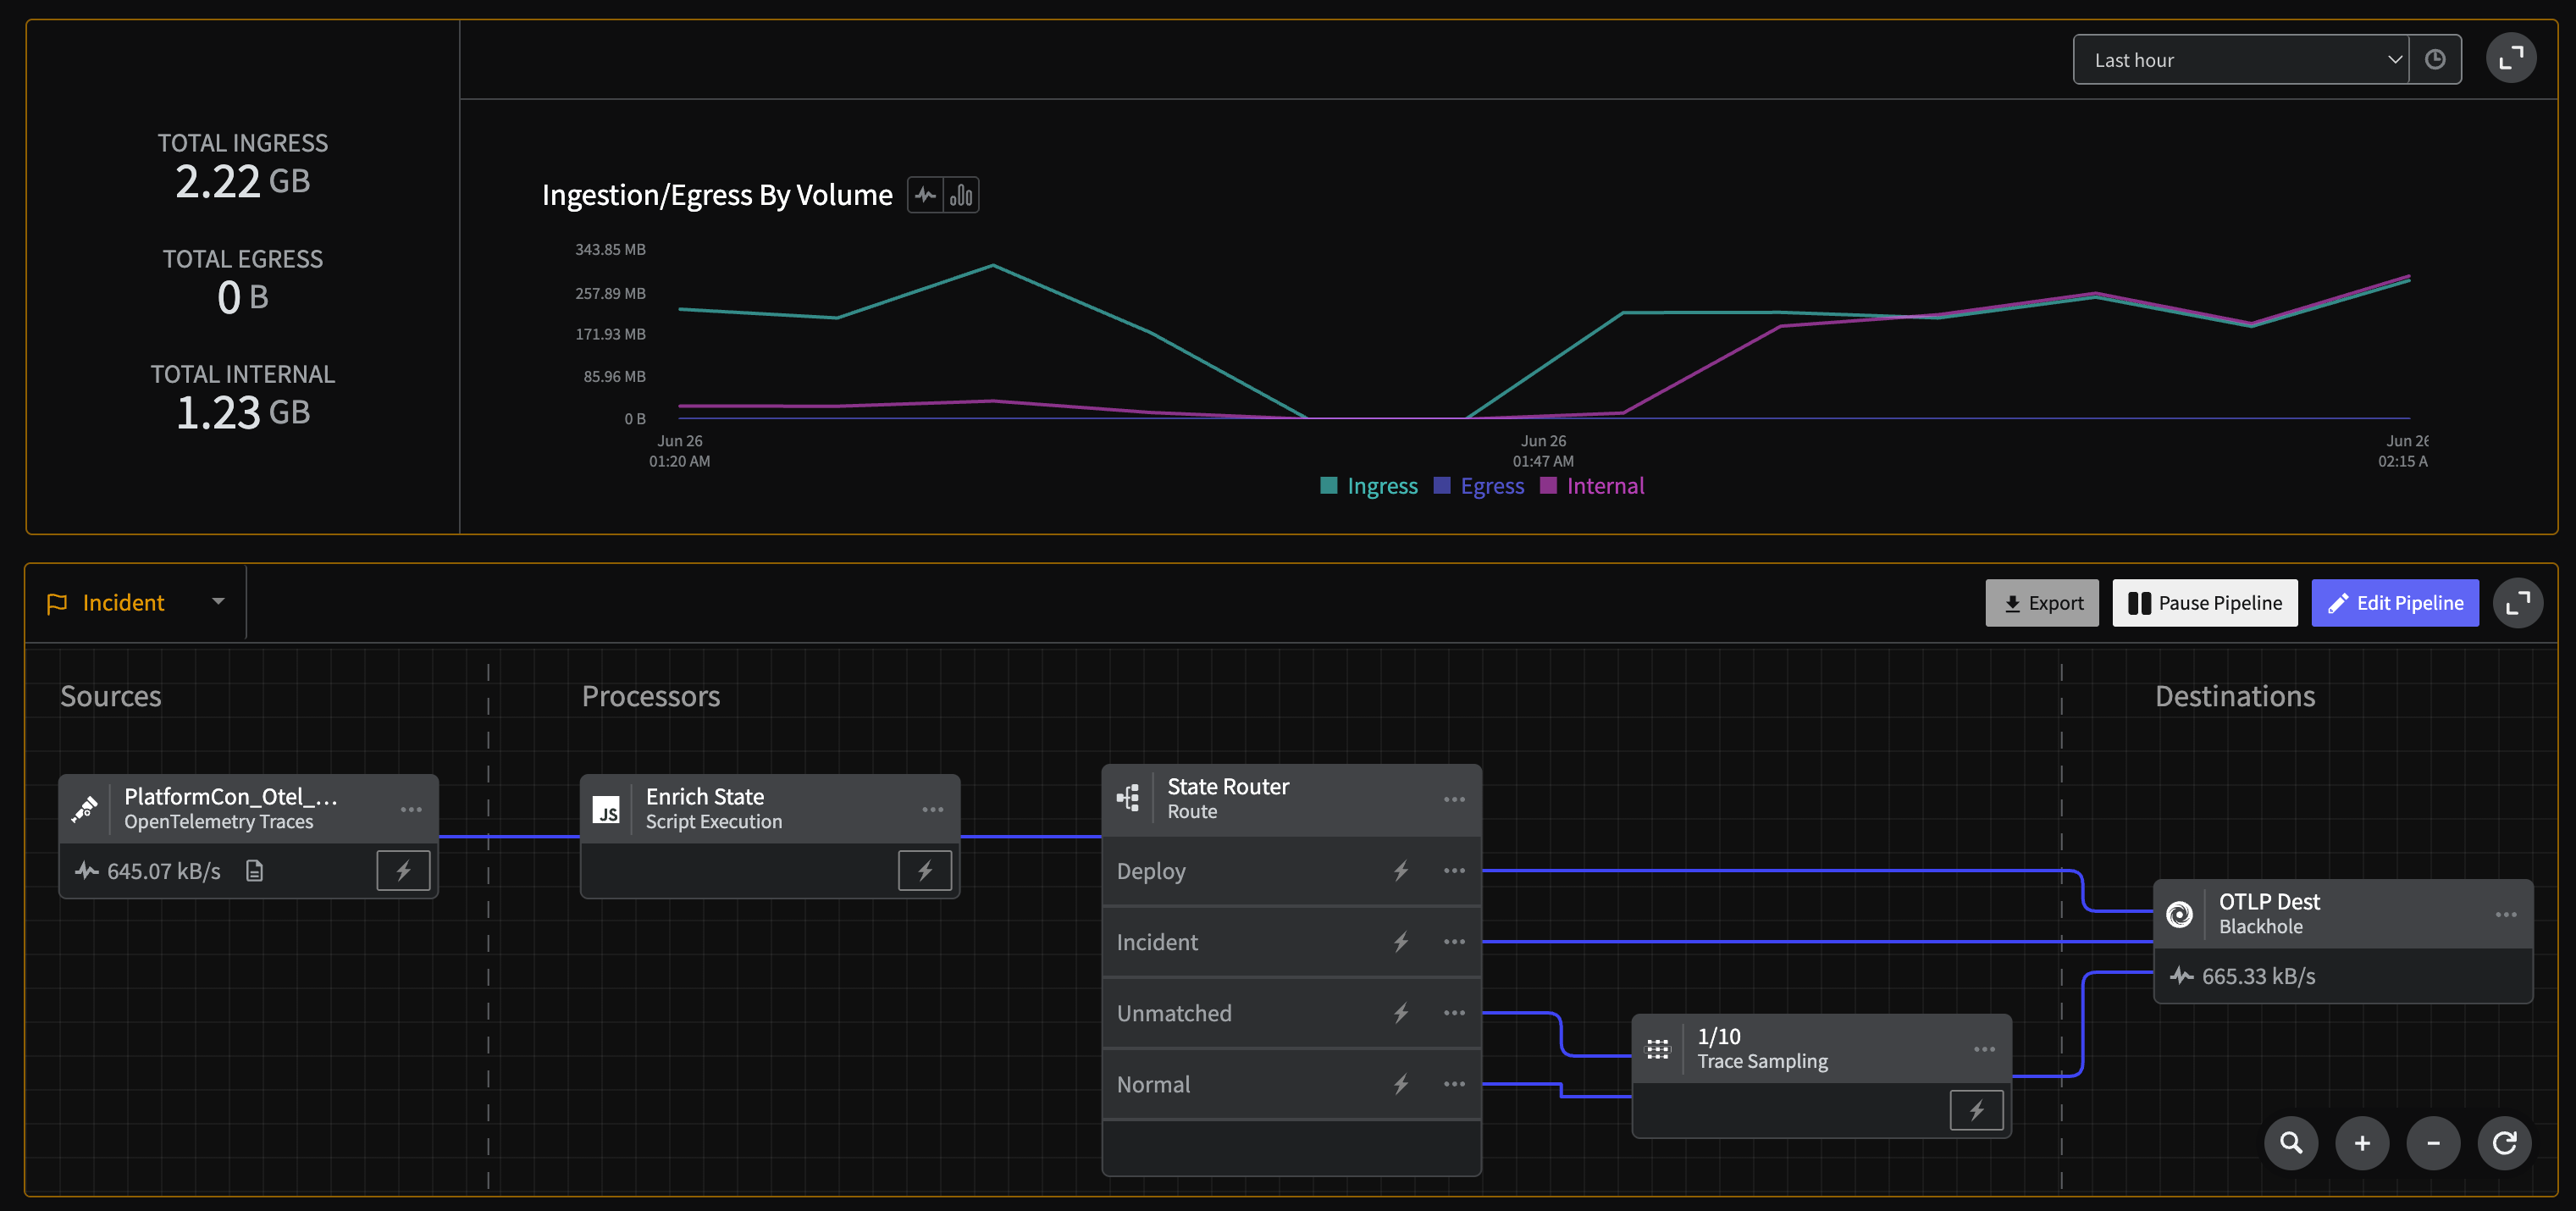
Incident Mode