Ways to Manage Usage
There are many ways to reduce and manage the amount of logging data used by your organization.
- Exclusion Rules - Use Exclusion Rules to control what's stored.
- Index Rate Alerts - Track sudden spikes in logging and receive alerts if logs exceed a certain threshold.
- Usage Quotas - Specify the amount of log data to store. Create alerts once storage limits are reached.
- Variable Retention Rules - Enterprise Only. Define how long logs are kept based on queries. These logs do not follow any other log retention rules set.
- Shut Off - Stop all incoming data.
- Usage API - Get information about your apps aggregated usage.
Usage Dashboard
The Usage Dashboard provides an overview of how much data your organization is ingesting. It shows:
- Estimated usage for the given month.
- Breakdown of data ingested by day.
- Last Month in Days - Amount of data ingested in the past 30 days.
- Last month in Days, Trends - Shows the top sources, apps, and tags that create the most logs.
📘 The Usage Dashboard only shows data for the 50 most popular apps, sources, and tags each day.
Last month in Days – Trends
The Last month in Days – Trends graph lets you show data in a stacked or unstacked view and compare the total usage.
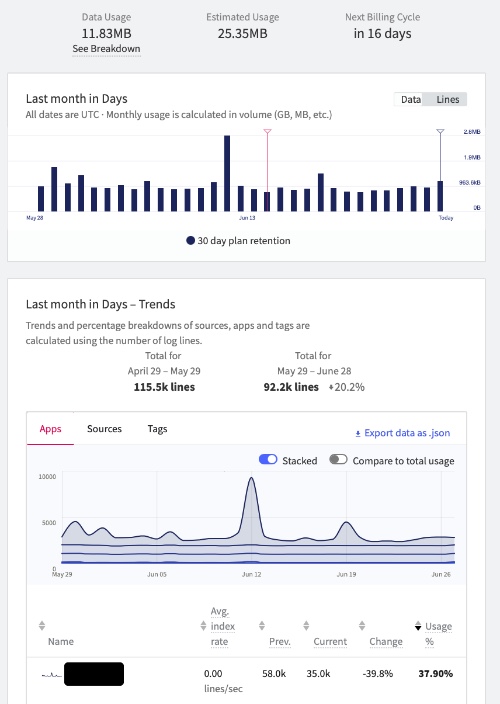
The Mezmo usage dashboard shows Last month in Days and Last month in Days – Trends.
Stacked and Unstacked
Toggling Stacked to on, will stack the data lines on top of each other and display the sum of all visible sources. The graph will also be updated to show how each app, source, or tag compares to the total.
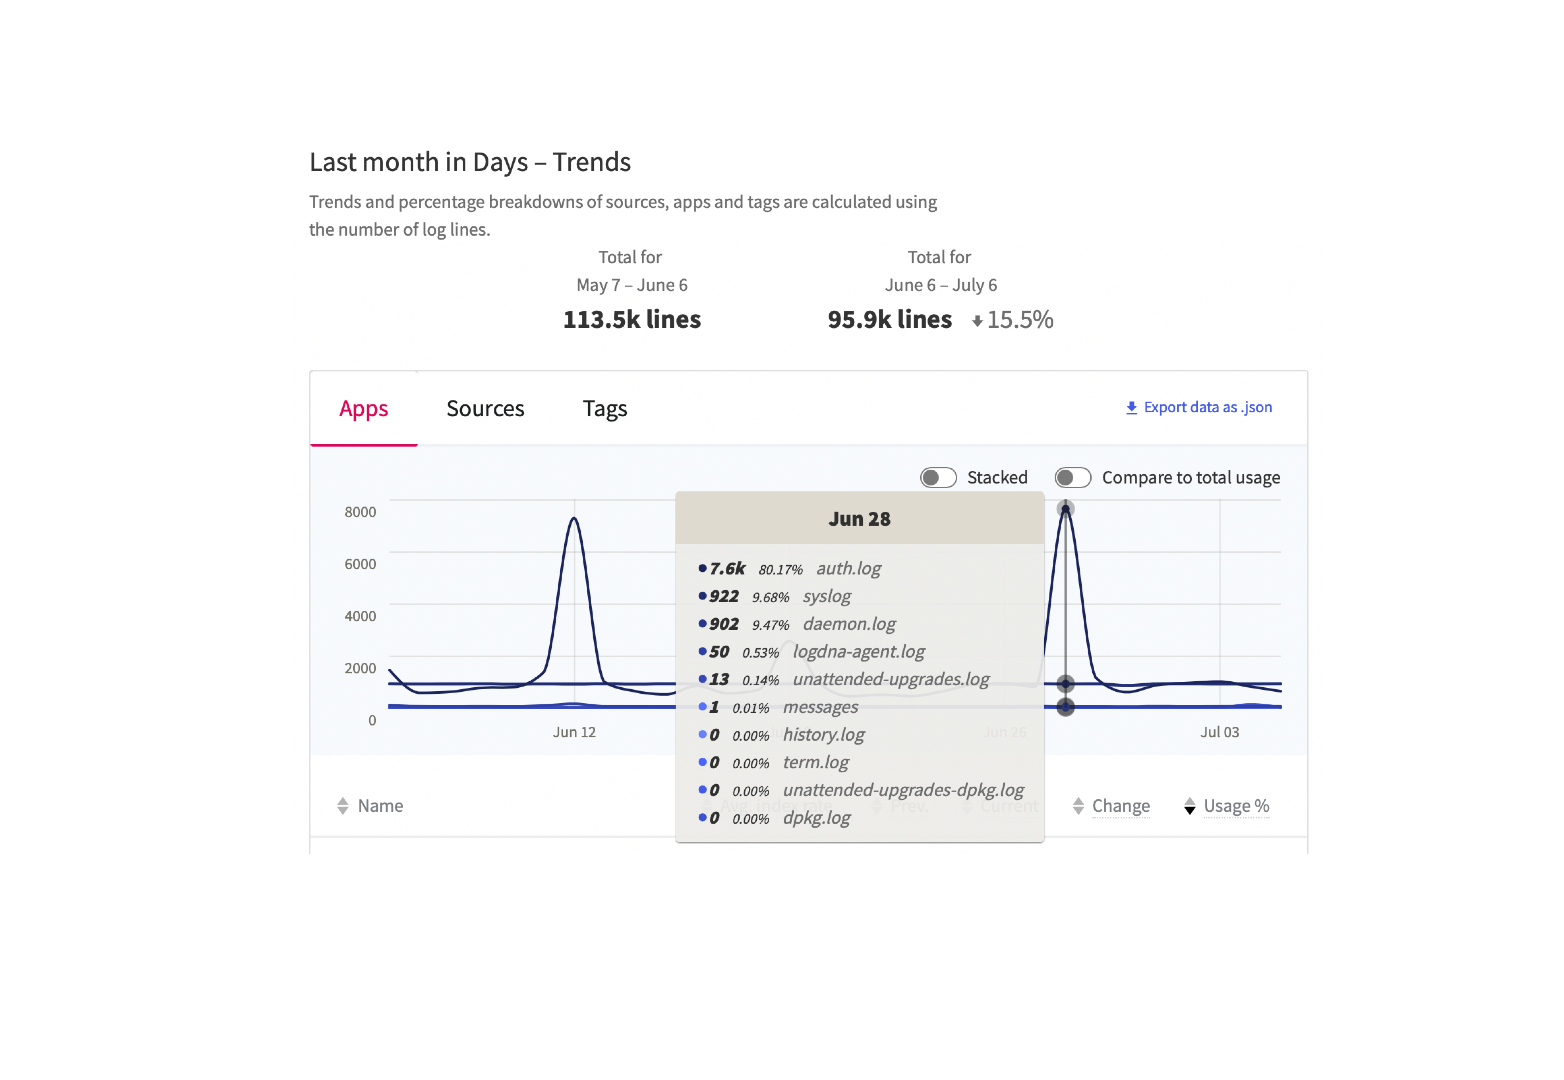
The Unstacked graph shows the total number of log lines for each data source.

The stacked graph shows sum of all logs compared to the visible sources. A new number representing the total is added when hovering over data sources.
Log Data Restoration
Restoration is a way to bring back, or restore, archived logs from cold storage. You can search for this data in the Mezmo user interface. This is useful for finding old bugs and having more context from older logs. Learn more about Data Restoration.
Email Digest
You can subscribe to a weekly or monthly digest that breaks down your usage data for the period. Email digests include:
- Total usage for the current billing cycle
- Comparison with the previous billing cycle
- Top apps, hosts, and tags by usage
- Days remaining in the current billing cycle
Variable Retention Breakdown
If your account has Variable Retention rules enabled, the email digest also includes a usage breakdown for each retention tier. For each tier, you'll see the top apps, hosts, and tags that contributed to that tier's usage, along with the retention period.
Usage Alerts
You can set up email alerts to notify you when you reach a percentage of the usage limit. The Usage Limit is the amount you want to use before getting an email alert. The Usage Limit only affects email alerts, and won't cause log ingestion to stop.
After defining a Usage Limit, add email recipients who will be notified when a certain usage percentage is reached. You can add as many email addresses as you need.
How Usage Alerts Work
We send Usage Alerts at the end of your billing cycle. For example, if you get billed on the 15th of every month, our counter resets on the 16th to start a new cycle. If this isn't a billing date, such as accounts on a free trial, Mezmo will default to the account creation date.
If you have a contract, your custom billing date may not match our system's cycle start date.
To find out if your accounts custom billing date and the system's counter dates are aligned, please navigate to the Last month in Days – Usage chart, where the red ticker identifies the date your accounts billing cycle restarts.
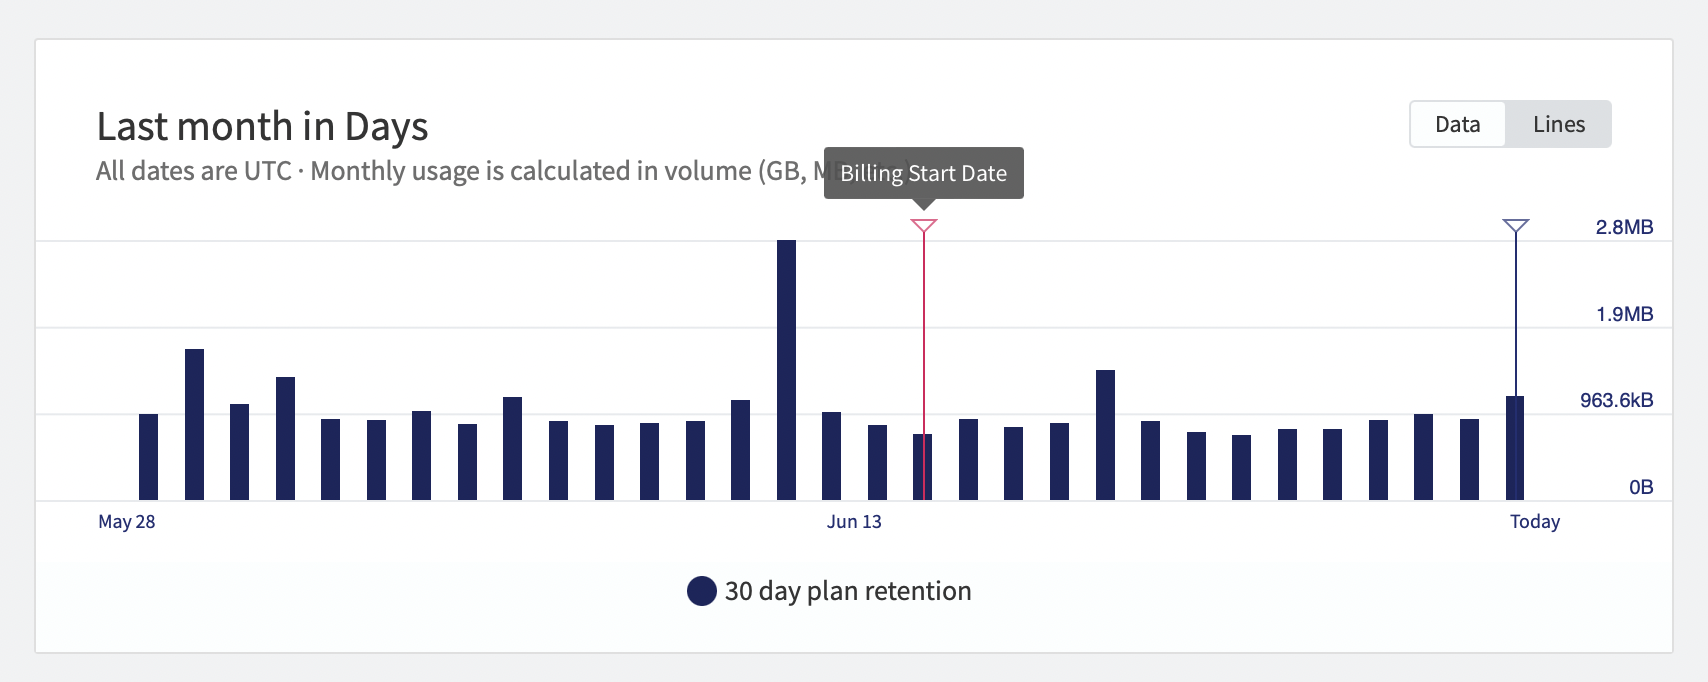
The billing start date is identified by the red line in the Last month in Days graph.