
If you run into any issues or have feedback on either the workshop or Pipeline, please reach out to us at support@mezmo.com.
Perequisites
A Mezmo account, you can sign up for a trial here.
Overview
In this workshop, we will be exploring telemetry data produced with the OpenTelemetry Demo while optimizing it for both MTTR and cost.
To accomplish this we will:
Create a OpenTelemetry Log, Metric, and Trace Shared Source in Mezmo.
Configure OpenTelemetry collector with Mezmo Shared Source credentials.
Explore the OpenTelemetry Logs via Data Profiling
Send log data to Mezmo Log Analysis
Aggregate specific log patterns
Parse custom Apache data
Aggregate OpenTelemetry Metrics to lower fidelity
Configure Pipelines to be Responsive (ie, capture full fidelity when in an incident or deployment state)
Final Product
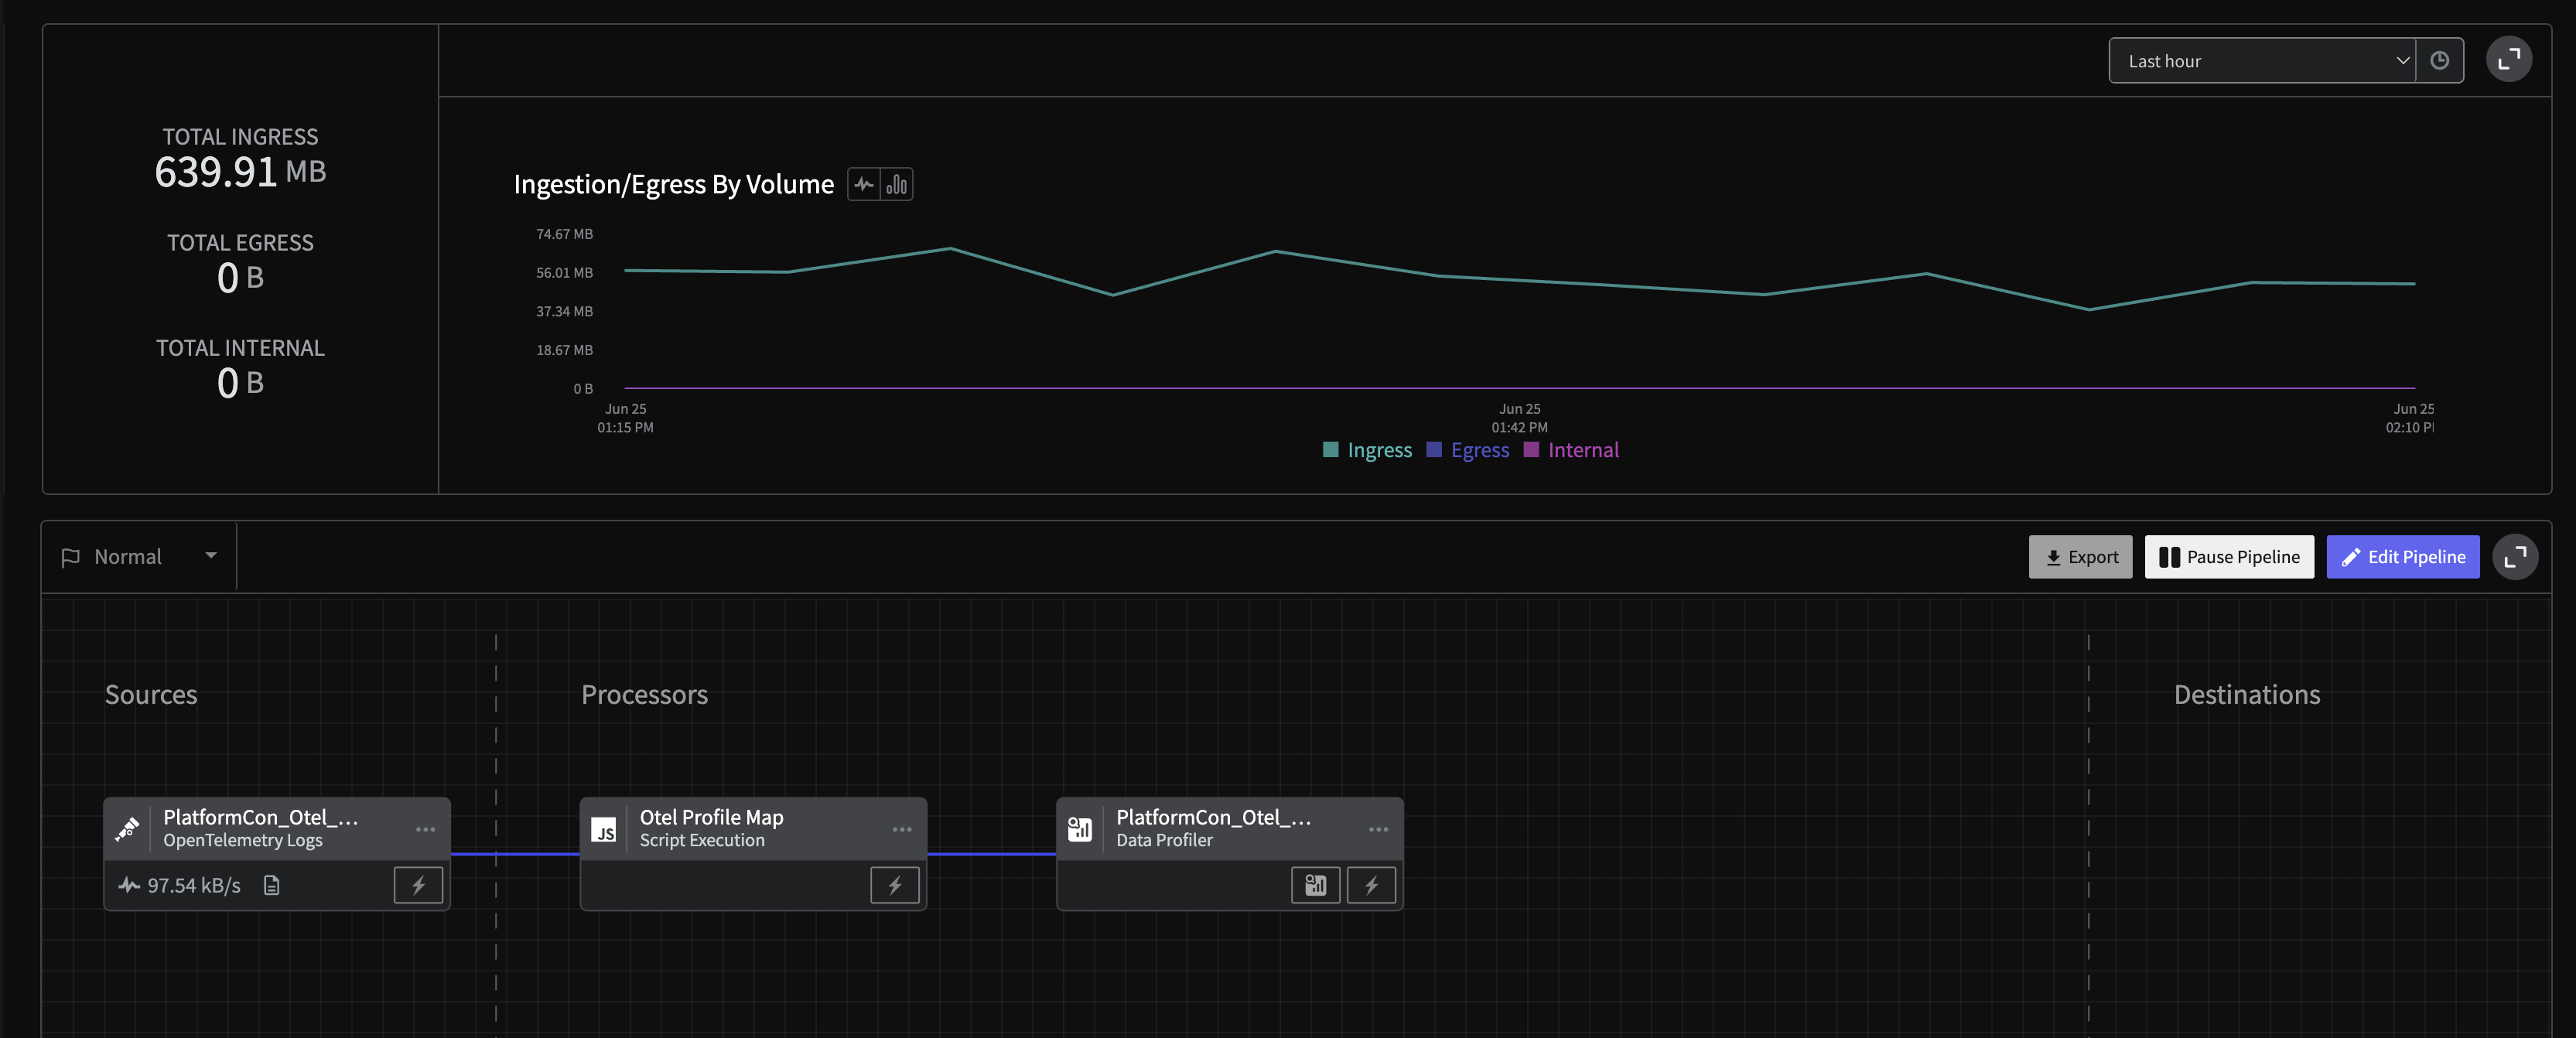
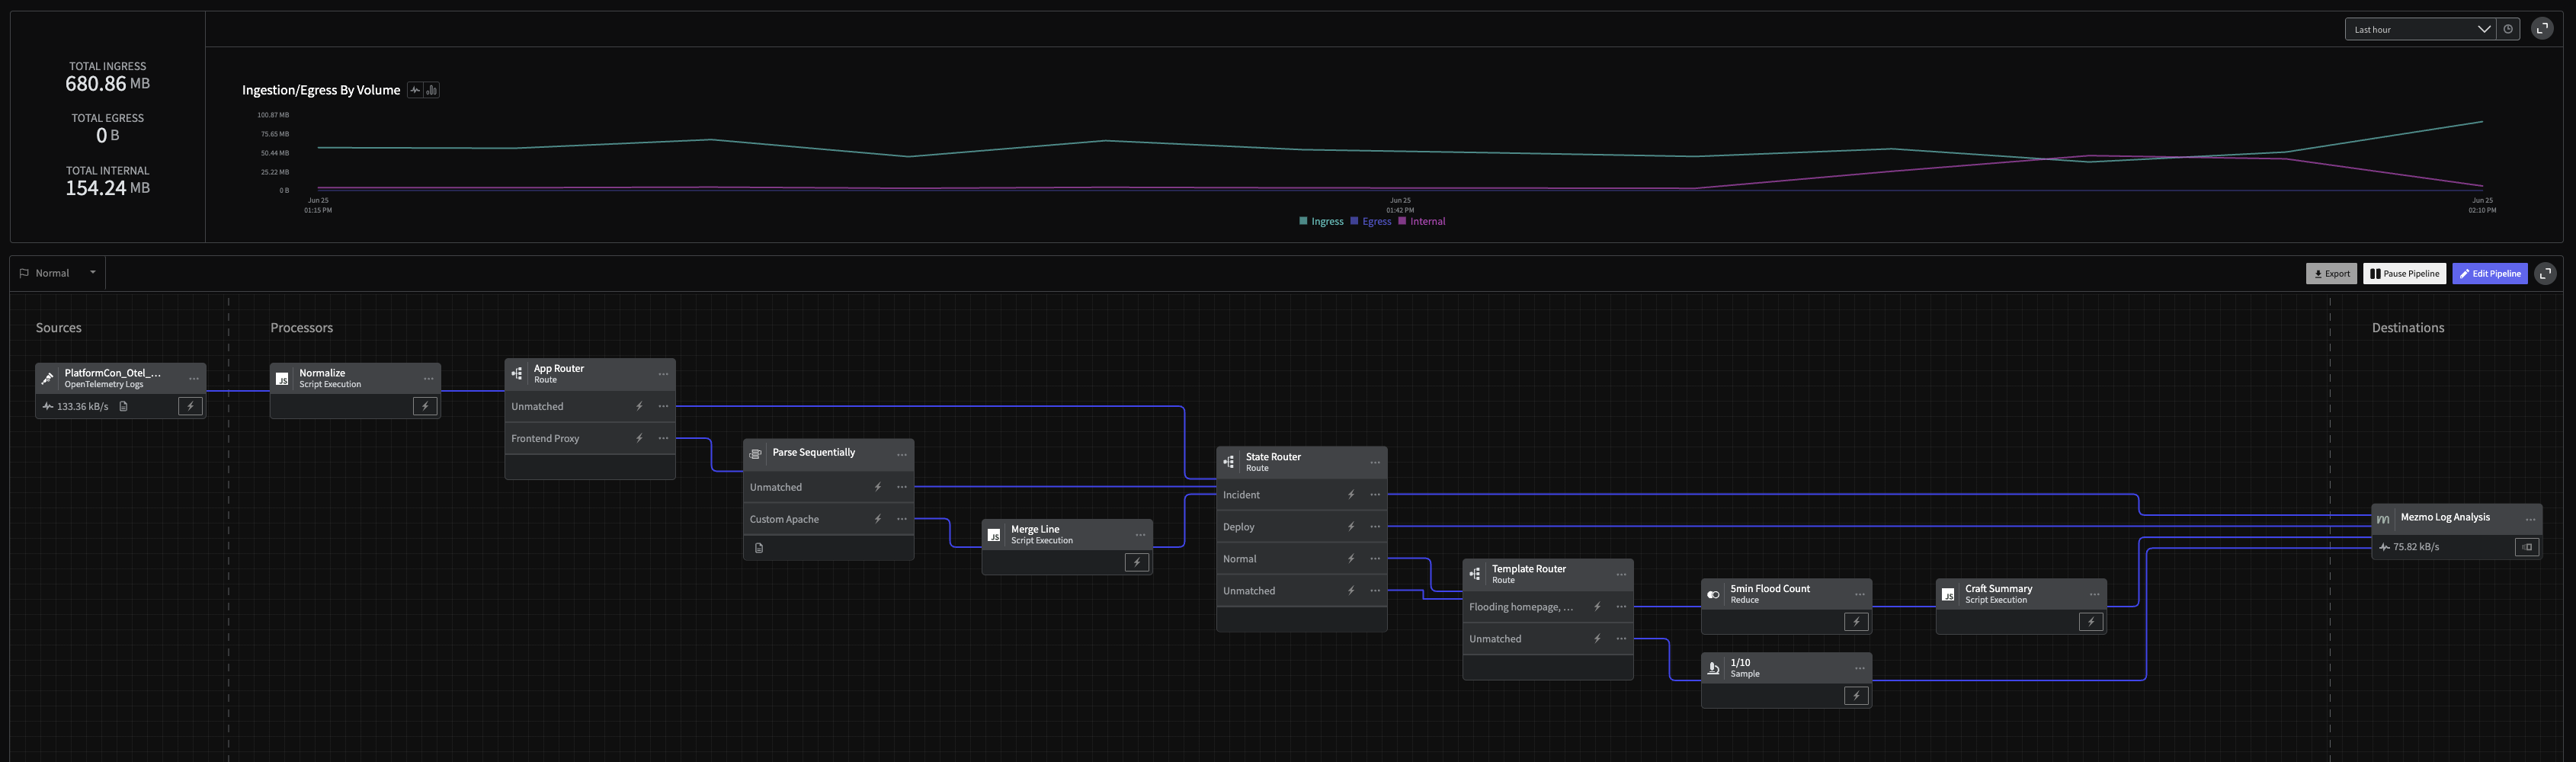
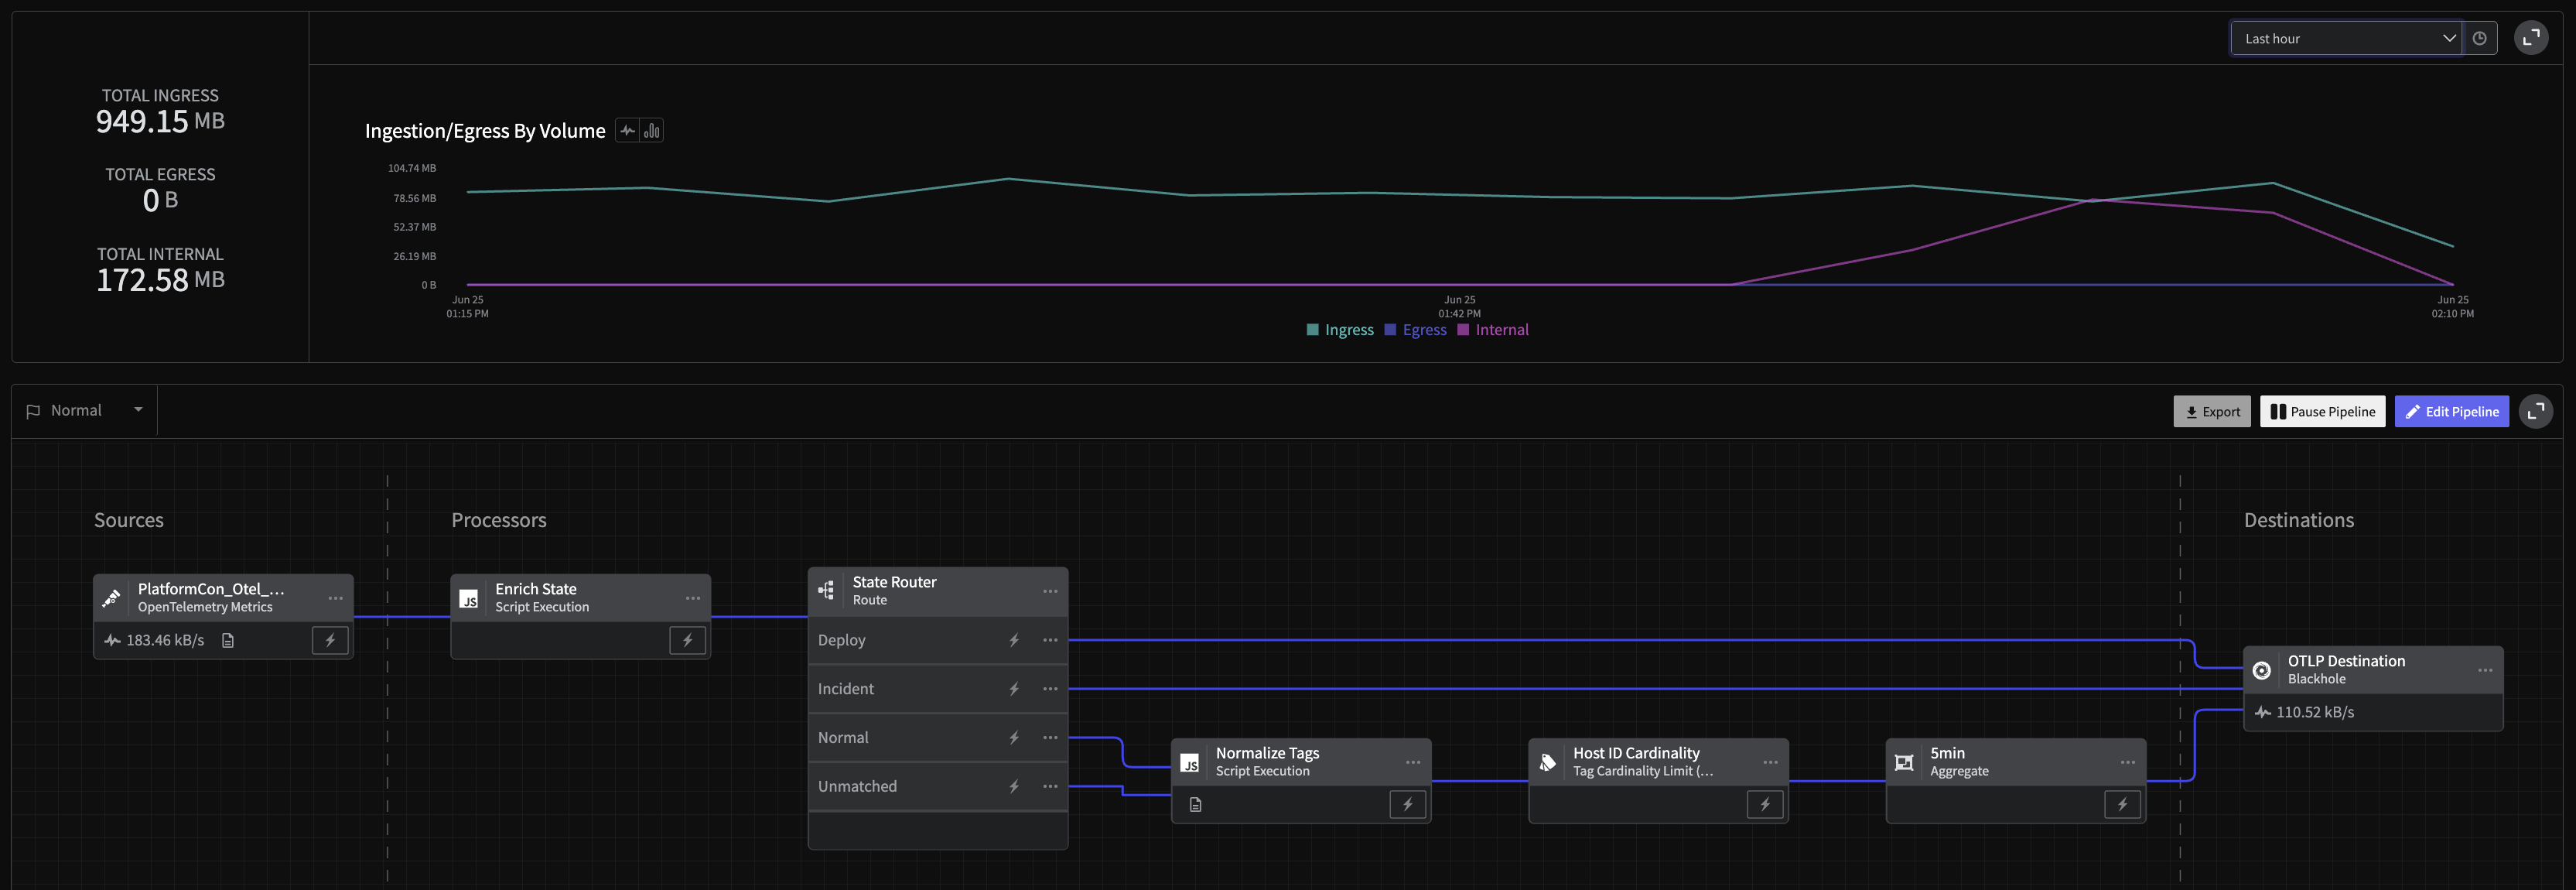
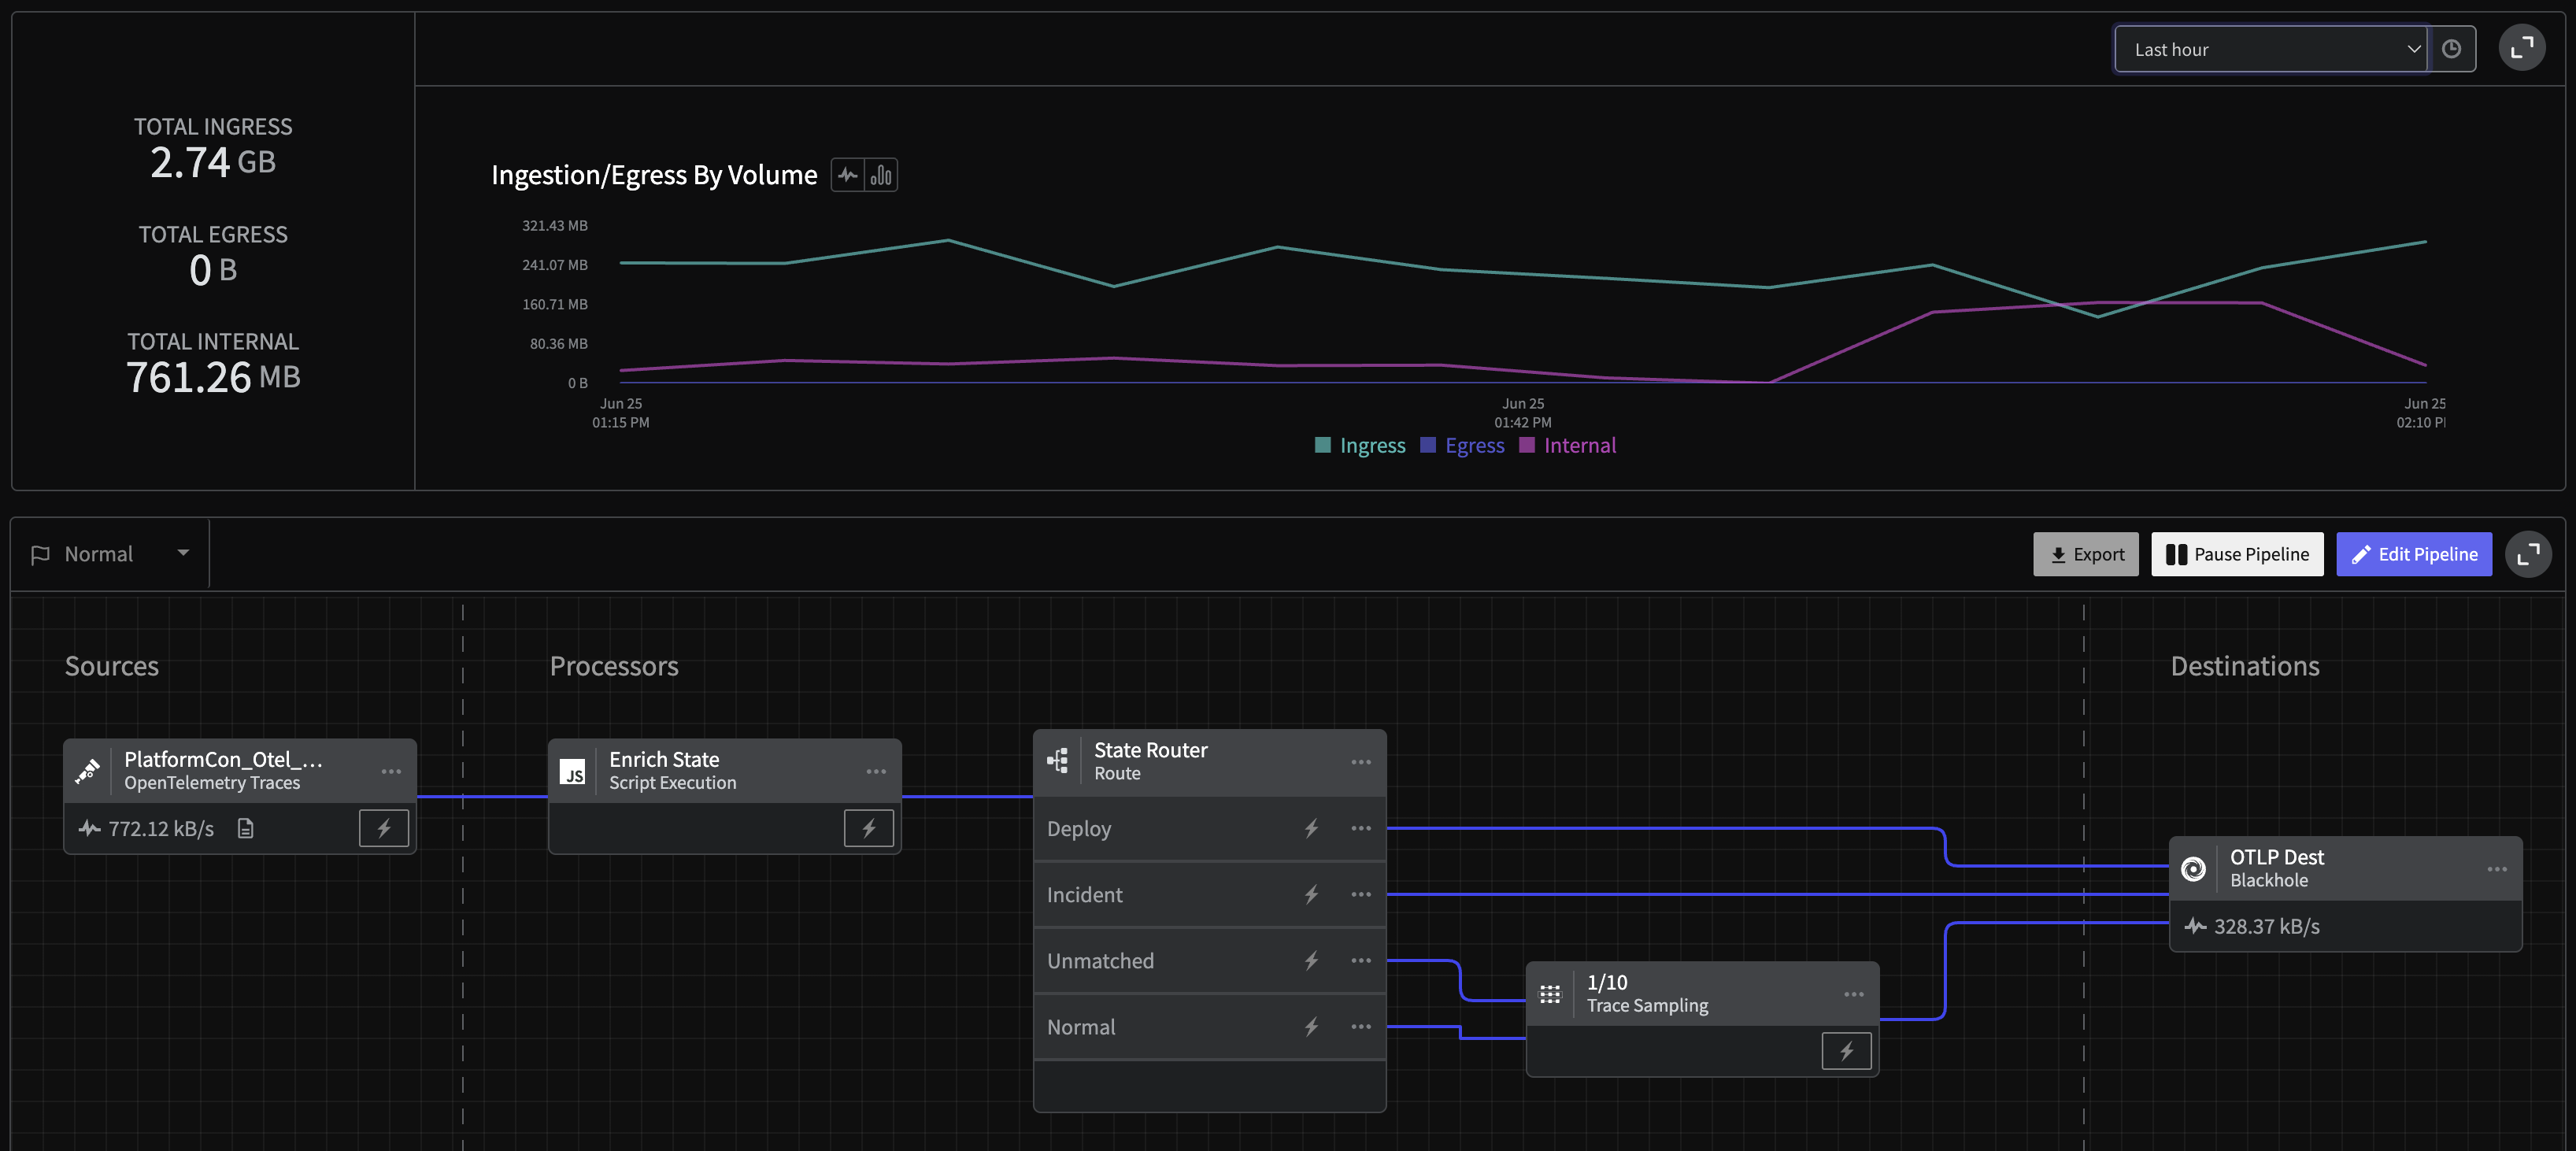
In the end you are going to build four Pipelines that look like these
Log Profiling Pipeline
Log Handler Pipeline
Metric Handler Pipeline
Trace Handler Pipeline
These pipelines will optimize your OpenTelemetry data by aggregating, parsing, and configuring data flow responsively. By allowing for easy, granular control you can make sure the right data winds up where it belongs.
The end result is a system that provides the insight needed, at the fidelity when it's needed, leading to an order of magnitude in savings.