Title
Create new category
Edit page index title
Edit category
Edit link
Add a Breakdown to a Graph
A breakdown is a view of your main graph. It shows the distribution of values for the aggregated plots in your graph. For example, you can create a breakdown for a graph on the request field to see the distribution of request values for the HTTP response codes you plotted in Add a Plot to a Graph. You can add different types of breakdowns depending on the kind of information you want to see, in this case you'll create a histogram breakdown.
Create a Histogram Breakdown
- Open the graph created in Create a Graph and Add a Plot to a Graph.
- Expand the downward arrow under the center of the graph.
- Select a breakdown type of Histogram.
- Set field name to Response.
- Click the Add Breakdown button.
The histogram shows a breakdown of the three plotted queries and which code returns the most HTTP responses.
In this example, the response code 404 returns the most.

Each graph can have five breakdowns.
Pie Chart Breakdown
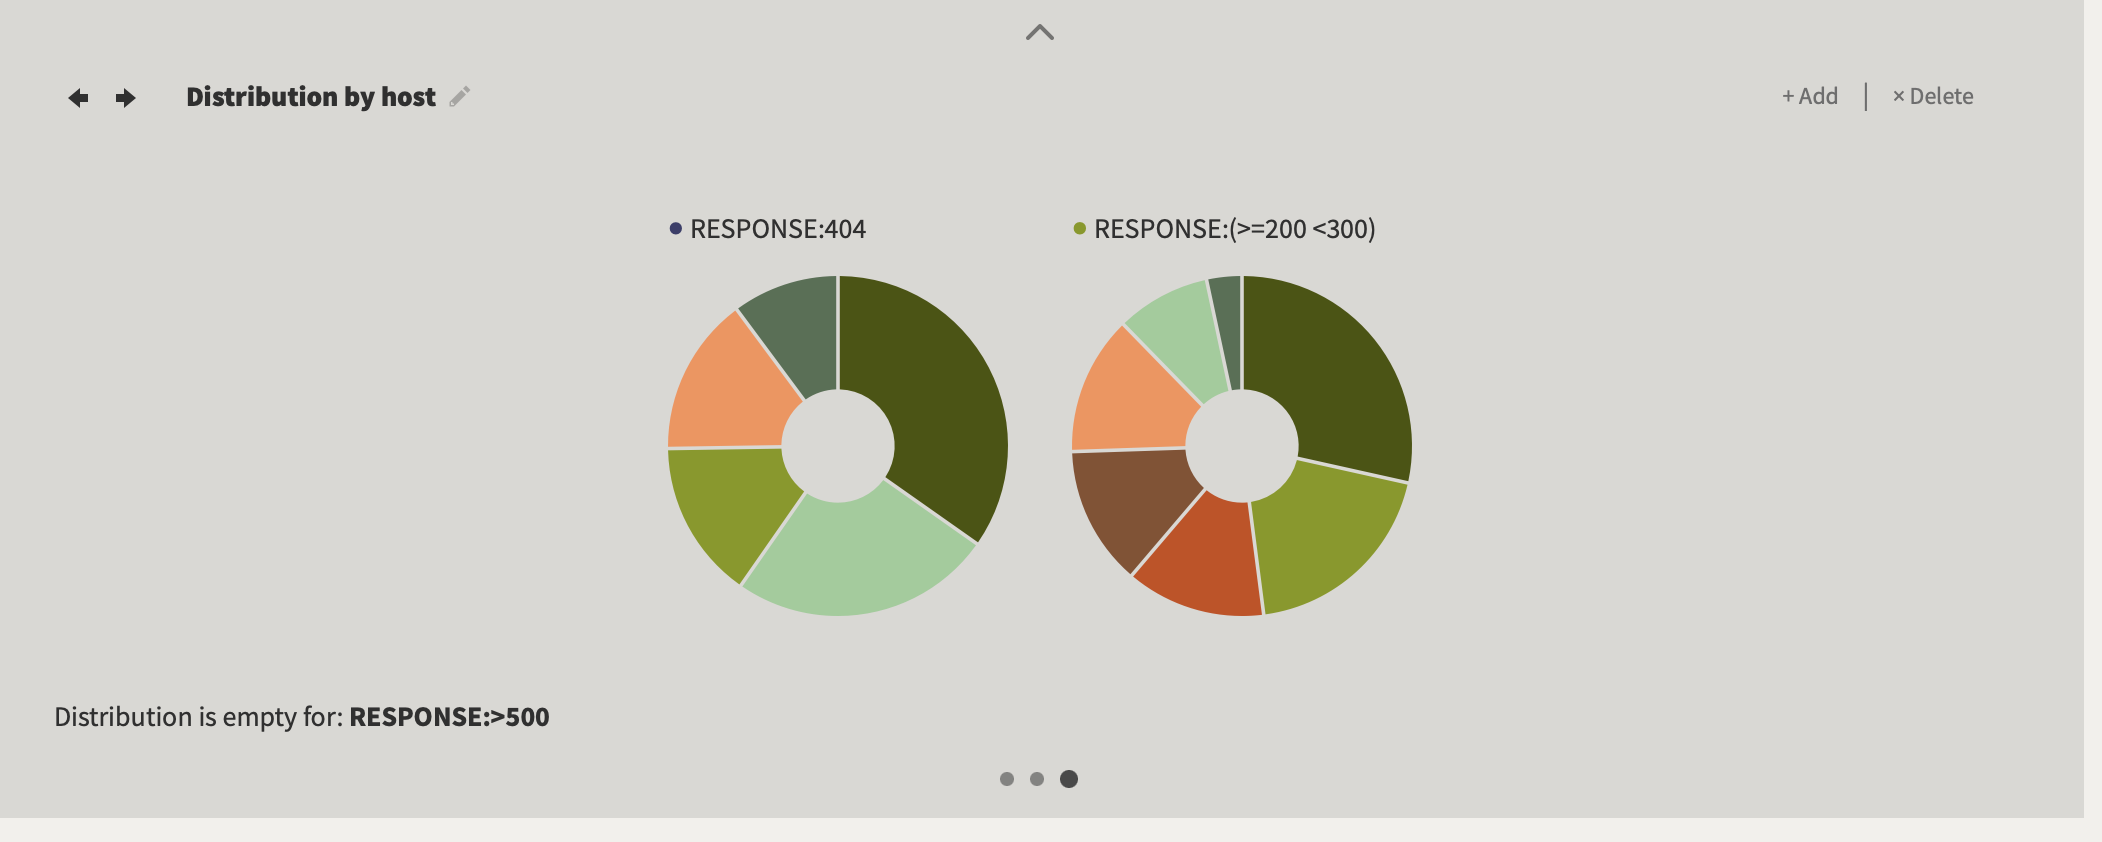
With a pie chart breakdown, you can see how the response codes are distributed across hosts.
- Click +Add.
- Select breakdown type Pie.
- Distribute by Fields.
- Set field to Host.
Hover over each part of the pie chart to see the hosts. In this example we can see a host that has a large number of 404's compared to the other hosts. There are no 500 response codes returned.
