> ## Documentation Index
> Fetch the complete documentation index at: https://docs.mezmo.com/llms.txt
> Use this file to discover all available pages before exploring further.
# View Pipeline Errors
> Find processing errors in a Pipeline using error indicators, the Error History view, and per-error log lines, plus error retention details.
## Error Indicators
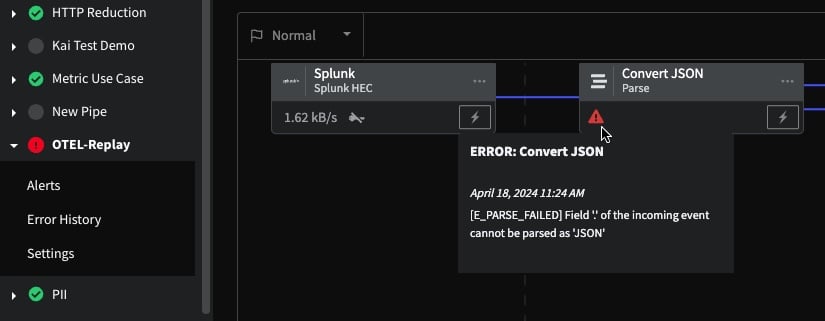
If an error is generated during the processing of data in your Pipeline, a red indicator will appear next to the name of the Pipeline, as well as on the node where the processing error occurs. Hover your mouse over the indicator on the node for more information about the error. The [Error Code Reference](/telemetry-pipelines/error-code-reference) contains more information about the specific types of errors for each Processor.
 ## View Error History
You can view the errors for any Pipeline by accessing its **Error History**.
1. Log in to the [Mezmo Web App](https://app.mezmo.com).
2. Click **Pipelines** in the Admin Panel.
3. Under **Deployed Pipelines**, click the arrow next to the Pipeline you want to view to open the **Pipeline Menu**.
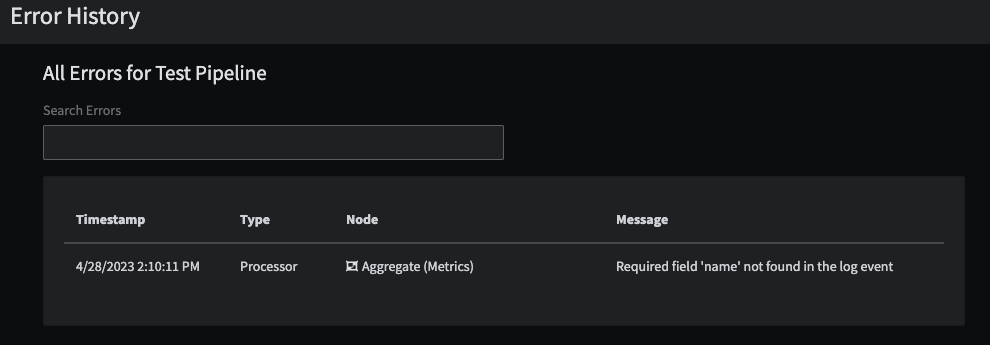
4. Click **Error History**. You will see a list of errors in order by **Timestamp,** along with information about the type, the affected node, and the error message. You can also search errors using character and term matching.
## View Error History
You can view the errors for any Pipeline by accessing its **Error History**.
1. Log in to the [Mezmo Web App](https://app.mezmo.com).
2. Click **Pipelines** in the Admin Panel.
3. Under **Deployed Pipelines**, click the arrow next to the Pipeline you want to view to open the **Pipeline Menu**.
4. Click **Error History**. You will see a list of errors in order by **Timestamp,** along with information about the type, the affected node, and the error message. You can also search errors using character and term matching.
 ## View Log Lines for Errors
You can view the specific log lines that have caused errors.
1. Open the **Error History** for the Pipeline.
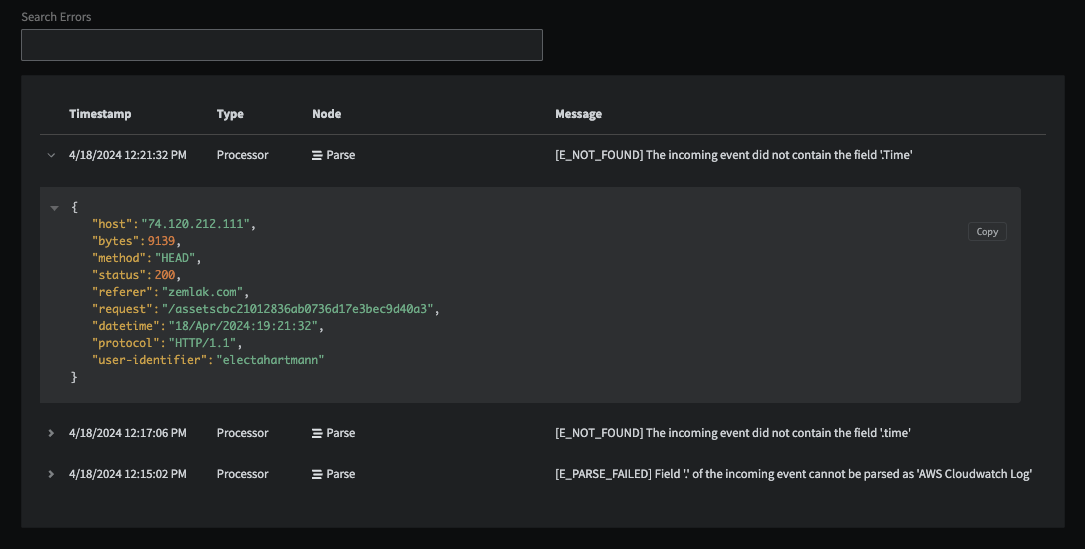
2. Click the arrow next to the error to view the log line that caused the error.
## View Log Lines for Errors
You can view the specific log lines that have caused errors.
1. Open the **Error History** for the Pipeline.
2. Click the arrow next to the error to view the log line that caused the error.
 ## Error Retention
* Pipeline error logs are retained for 10 days. A scheduled task runs every 12 hours and deletes logs that are over 10 days old.
* If a repeat error occurs, only the timestamp is updated , and the additional log entries are not retained
## Error Retention
* Pipeline error logs are retained for 10 days. A scheduled task runs every 12 hours and deletes logs that are over 10 days old.
* If a repeat error occurs, only the timestamp is updated , and the additional log entries are not retained