> ## Documentation Index
> Fetch the complete documentation index at: https://docs.mezmo.com/llms.txt
> Use this file to discover all available pages before exploring further.
# Replay Buffered Data
> Automatically re-process recently buffered push-source data through a Responsive Pipeline when it enters incident state, so full-fidelity data is indexed into Mezmo Log Analysis.
When a Responsive Pipeline switches to its `incident` state, Replay re-reads a recent window of data from the Pipeline's internal durable buffer for push sources. It then re-processes that data through the same Pipeline with optimizations turned off, so full-fidelity data is indexed into Mezmo Log Analysis for the window leading up to the incident. Replay is opt-in and configured per operational state.
Replay solves a common gap in incident response. Without it, only data that arrives *after* the state switch receives high-fidelity treatment. The minutes just before the incident was detected are lost — a cost-optimized Pipeline would otherwise have sampled or dropped them. Replay recovers that recent window so you have the full context leading up to the incident.
Replay re-reads the Pipeline's short-lived internal buffer of recent push-source data and is triggered automatically by an operational-state change. It is not the same as [Archive and Restore Telemetry Data](/telemetry-pipelines/archive-restore-data) or the [Pipeline Data Restoration](/telemetry-pipelines/pipeline-data-restoration-source) source, which restore data from long-term archive storage on demand.
## How it Works
Replay adds additional consumers to the internal durable buffer that backs push sources, re-reading recently buffered events from an earlier point and sending them back through the same Pipeline. Because replay runs during the `incident` state, the optimization Processors (such as **Sample**) that you disable in incident mode stay off, so the replayed data is processed at full fidelity and indexed into Mezmo Log Analysis.
For background on operational states and how Processors change their behavior when a Pipeline enters an incident, see [Configure Responsive Pipelines](/telemetry-pipelines/configure-responsive-pipelines).
## Prerequisites and Limitations
* **Push sources only.** Replay works only with push sources such as HTTP, OpenTelemetry, and Webhook sources, because only these are backed by the internal durable buffer. Pull sources cannot be replayed.
* **Recent data only.** The buffer retains a limited window of recent data, so only recently buffered events can be replayed.
* **Responsive Pipeline required.** The Pipeline must be a Responsive Pipeline with its operational state configured — see [Configure Responsive Pipelines](/telemetry-pipelines/configure-responsive-pipelines).
* **Availability.** Replay is not enabled by default on every account. If you don't see replay settings for your Pipeline, contact Mezmo to have the feature enabled.
## Enable and Configure Replay
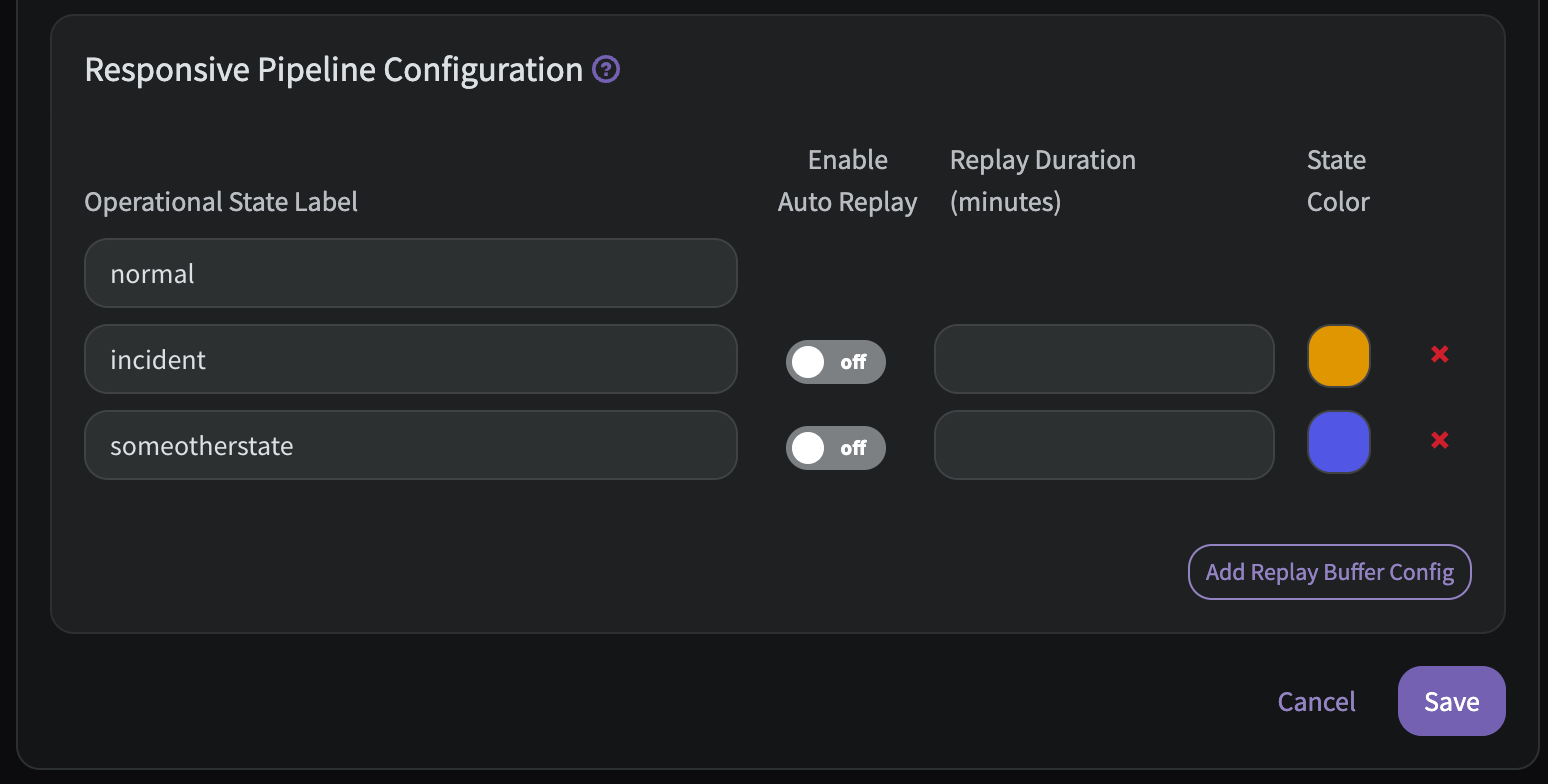
Replay is opt-in and configured per operational state. For each operational state (for example, `incident`) you can turn on automatic replay and set how far back into the buffer to read, expressed as a number of minutes. These settings correspond to the `auto_replay` and `replay_duration_minutes` values for the state. You configure these settings per operational state on the Pipeline in the [Mezmo Web App](https://app.mezmo.com), in the same place you manage the Pipeline's operational state — see [Configure Responsive Pipelines](/telemetry-pipelines/configure-responsive-pipelines).
The replay duration controls how far back in the buffer replay starts reading. It is measured by position in the buffer, not by any timestamp inside the events. You set it in minutes, up to a maximum.
 The exact default and maximum replay duration are configured in the product. Confirm the values available for your account in the Mezmo Web App.
A typical setup enables automatic replay on the `incident` state, so a replay starts whenever the Pipeline enters an incident.
## What Happens During a Replay
While the Pipeline is in the `incident` state, the optimization Processors you disabled for that state stay off. Replayed events are therefore processed at full fidelity and indexed into Mezmo Log Analysis alongside newly arriving data.
Because replayed data is re-processed through the Pipeline, events that were already indexed during normal operation (for example, sampled events) may appear again. Expect some duplication for the overlapping window.
Replay indexes the replayed window at full fidelity, so it re-ingests data that a cost-optimized Pipeline would normally have reduced. Expect a temporary increase in ingested volume for the replayed window. Set the replay duration to the shortest window that gives responders the context they need.
A replay stops when either of the following occurs:
* It reaches the point in the buffer that was captured at the moment the Pipeline entered the `incident` state. Replay does not re-process data that arrived after the state switch.
* You switch the operational state back to `normal`.
A Pipeline does not automatically return to `normal` when a replay finishes. Switch it back yourself once the incident is resolved.
## Monitor a Replay
### Visual Indicators
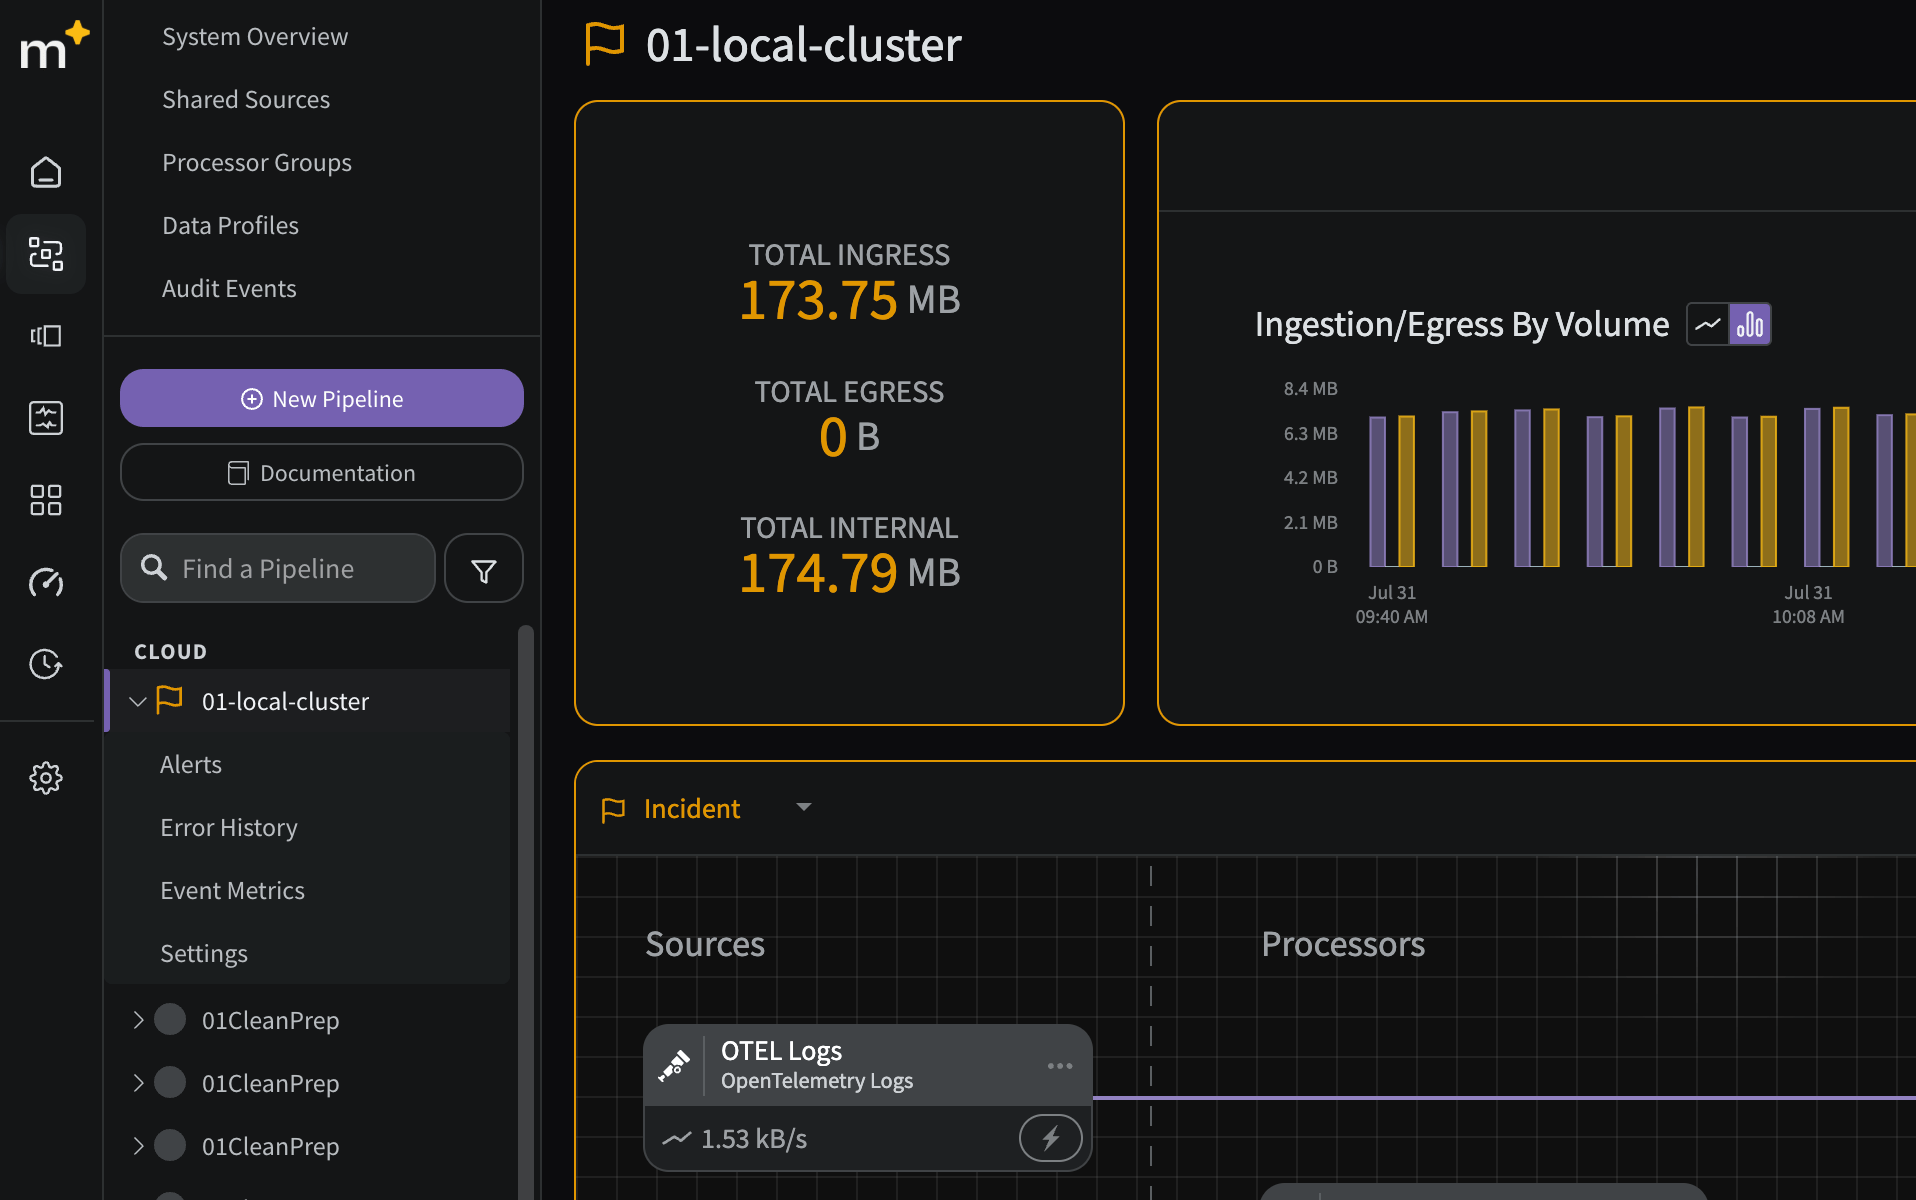
The pipeline list and the pipeline itself will be highlighted by the color selected above when your pipeline enters the `incident` state:
The exact default and maximum replay duration are configured in the product. Confirm the values available for your account in the Mezmo Web App.
A typical setup enables automatic replay on the `incident` state, so a replay starts whenever the Pipeline enters an incident.
## What Happens During a Replay
While the Pipeline is in the `incident` state, the optimization Processors you disabled for that state stay off. Replayed events are therefore processed at full fidelity and indexed into Mezmo Log Analysis alongside newly arriving data.
Because replayed data is re-processed through the Pipeline, events that were already indexed during normal operation (for example, sampled events) may appear again. Expect some duplication for the overlapping window.
Replay indexes the replayed window at full fidelity, so it re-ingests data that a cost-optimized Pipeline would normally have reduced. Expect a temporary increase in ingested volume for the replayed window. Set the replay duration to the shortest window that gives responders the context they need.
A replay stops when either of the following occurs:
* It reaches the point in the buffer that was captured at the moment the Pipeline entered the `incident` state. Replay does not re-process data that arrived after the state switch.
* You switch the operational state back to `normal`.
A Pipeline does not automatically return to `normal` when a replay finishes. Switch it back yourself once the incident is resolved.
## Monitor a Replay
### Visual Indicators
The pipeline list and the pipeline itself will be highlighted by the color selected above when your pipeline enters the `incident` state:
 ### Check Replay Status with the API
The Telemetry Pipelines API provides read-only endpoints to list and inspect replays:
```none theme={null}
GET /v3/pipeline/replay List all replays for the account
GET /v3/pipeline/replay?pipeline_id= List replays for a specific pipeline
GET /v3/pipeline/replay/ Get a single replay
```
These endpoints report replay status only. A replay is started by the operational-state change — in the Web App, via the API, or from the [Script Execution Processor](/telemetry-pipelines/js-script-processor) — not by calling a replay endpoint.
For example, to list all replays for your account:
```bash theme={null}
curl -s --request GET \
--url 'https://api.mezmo.com/v3/pipeline/replay' \
-H 'Authorization: Token <>' \
-H 'Content-Type: application/json'
```
For details on generating a token and authenticating requests, see [Authenticating with the API](/docs/authenticating-with-the-api).
## Related
* [Configure Responsive Pipelines](/telemetry-pipelines/configure-responsive-pipelines)
* [Filter Processor](/telemetry-pipelines/filter-processor)
* [Route Processor](/telemetry-pipelines/route-processor)
* [Script Execution Processor](/telemetry-pipelines/js-script-processor)
### Check Replay Status with the API
The Telemetry Pipelines API provides read-only endpoints to list and inspect replays:
```none theme={null}
GET /v3/pipeline/replay List all replays for the account
GET /v3/pipeline/replay?pipeline_id= List replays for a specific pipeline
GET /v3/pipeline/replay/ Get a single replay
```
These endpoints report replay status only. A replay is started by the operational-state change — in the Web App, via the API, or from the [Script Execution Processor](/telemetry-pipelines/js-script-processor) — not by calling a replay endpoint.
For example, to list all replays for your account:
```bash theme={null}
curl -s --request GET \
--url 'https://api.mezmo.com/v3/pipeline/replay' \
-H 'Authorization: Token <>' \
-H 'Content-Type: application/json'
```
For details on generating a token and authenticating requests, see [Authenticating with the API](/docs/authenticating-with-the-api).
## Related
* [Configure Responsive Pipelines](/telemetry-pipelines/configure-responsive-pipelines)
* [Filter Processor](/telemetry-pipelines/filter-processor)
* [Route Processor](/telemetry-pipelines/route-processor)
* [Script Execution Processor](/telemetry-pipelines/js-script-processor)