> ## Documentation Index
> Fetch the complete documentation index at: https://docs.mezmo.com/llms.txt
> Use this file to discover all available pages before exploring further.
# Configure Responsive Pipelines
> Pre-configure Pipelines to switch between normal and incident states automatically, balancing high-fidelity data with cost reduction.
Responsive Pipelines enable you to pre-configure a Pipeline to change behavior automatically in the case of an incident. This makes it easier to balance the need for high-fidelity data required during incident response, with the need to reduce data load for cost reduction.
Responsive Pipelines adjust their behavior in response to specific triggers, such as the detection of a new critical incident. State change can be triggered through API calls from external incident response systems, such as PagerDuty, or you can activate it manually in the Pipeline in the [Mezmo Web App](https://app.mezmo.com).
This screenshot shows a Pipeline that, in **Monitoring** mode, drops `Status 200` events, and converts other HTTP Status events to metrics. In **Incident** Mode, the Route Processor sends the full data stream to Mezmo Log Analysis.
## How it Works
Mezmo Responsive Pipelines introduces a state variable `operational_state` that is associated with each Pipeline. The value for this state is either `normal`or `incident`, and the Processors in the Pipeline can change their functioning based on the value. For example, the **Sample** Processor can be disabled if `operational_state=incident` so that during the incident, you can have high fidelity data for further analysis.
## Set the Pipeline Operational State
You can change the operational state of a Pipeline manually through the Mezmo Web App, or through the Telemetry Pipelines API.
### Mezmo Web App
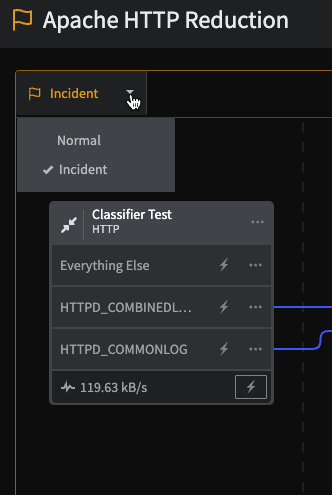
You can change the operational state of a Pipeline in the Mezmo Web App by selecting the state in the upper-left corner of the Pipeline Map. The state of the Pipeline is also shown in the Pipeline name, with an orange flag indicating the **Incident** state.
You should change the state of a Pipeline in the Mezmo App at least once to initialize the Pipeline's state table so it can be used with the API.
### Use State Variables in Filter and Route Processors
Reference state variables directly in the **Field** property of [Filter](/telemetry-pipelines/filter-processor) and [Route](/telemetry-pipelines/route-processor) processors using the `state.` syntax. This lets you change processor behavior based on the pipeline's operational state.
To route events based on the operational state, set the routing conditions as follows:
```none theme={null}
Route Processor Configuration
if (state.operational_state equal 'normal')
if (state.operational_state equal 'incident')
```
### Script Execution Processor (Alternative)
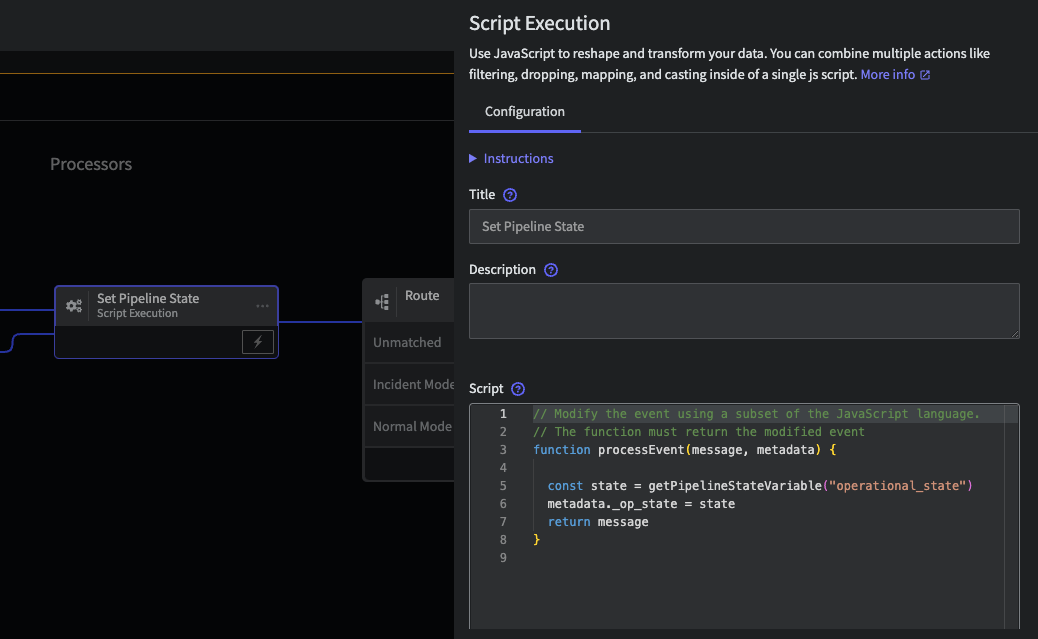
Alternatively, you can use the [Script Execution Processor](/telemetry-pipelines/js-script-processor) to add the operational state as metadata to a message for more advanced use cases.
This code shows how to get the Pipeline state variable and set it as message metadata:
```javascript theme={null}
function processEvent(message, metadata, timestamp, annotations) {
const state = getPipelineStateVariable("operational_state")
message.op_state = state
return message
}
```
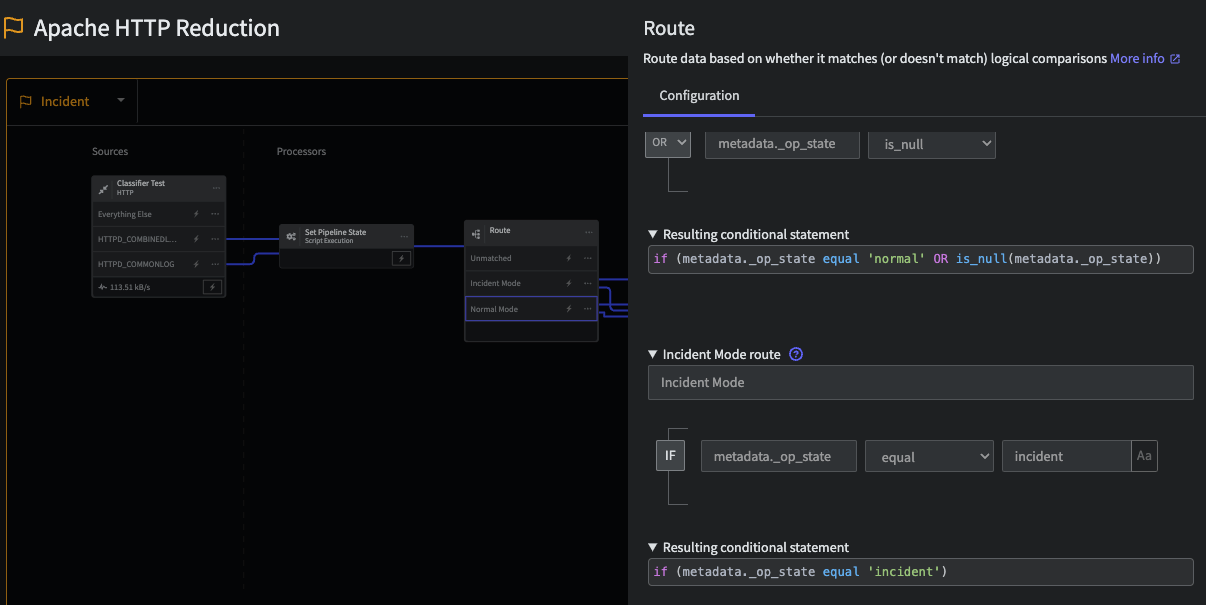
You can then use the value of `op_state` in other processors:
```none theme={null}
Route Processor Configuration
if (metadata._op_state equal 'normal' OR is_null(metadata._op_state))
if (metadata._op_state equal 'incident')
```
### API
You can get and set the value of the Pipeline operational state with the Telemetry Pipelines API:
Get the `state_id`:
```bash theme={null}
curl -s --request GET \
--url 'https://api.mezmo.com/v3/pipeline/state-variable' \
-H 'Authorization: Token <>' \
-H 'Content-Type: application/json' \
--data '{"pipeline_id": "<>"}' | jq '.data[0].state'
```
Set the state:
```bash theme={null}
curl -i --request PUT \
--url 'https://api.mezmo.com/v3/pipeline/state-variable/<>' \
-H 'Authorization: Token <>' \
-H 'Content-Type: application/json' \
--data '{"pipeline_id": "<>", "state": {"operational_state": "incident"}}'
```
## Interactive Demo
This interactive demo illustrates a telemetry pipeline that is configured to respond to a Datadog data volume spike incident. You will need to have pop-ups enabled to view the demo. You can also [view the demo without pop-ups](https://www.mezmo.com/demos/responsive-pipeline-volume-spike) at mezmo.com
\
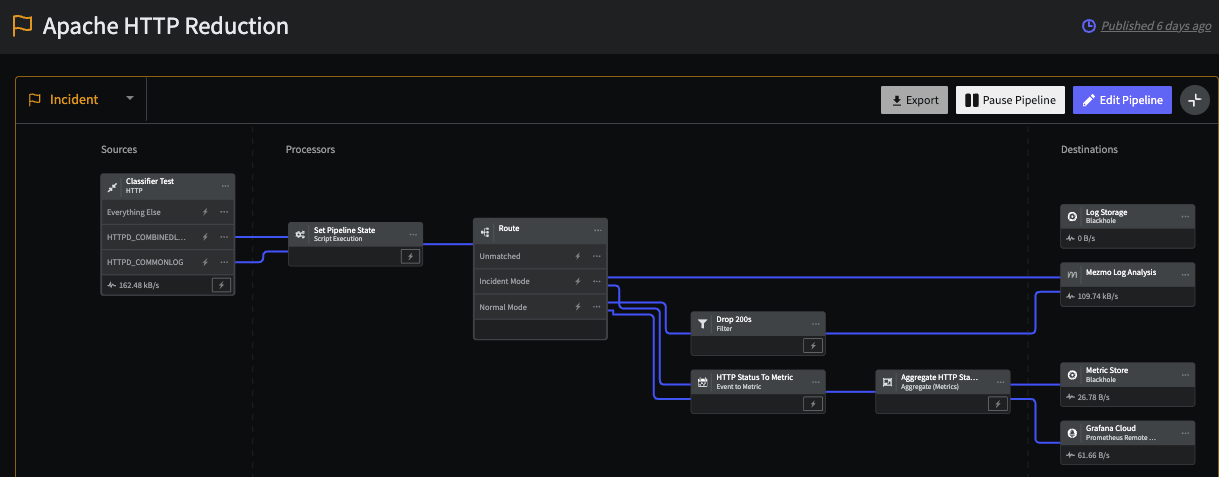 This screenshot shows a Pipeline that, in **Monitoring** mode, drops `Status 200` events, and converts other HTTP Status events to metrics. In **Incident** Mode, the Route Processor sends the full data stream to Mezmo Log Analysis.
## How it Works
Mezmo Responsive Pipelines introduces a state variable `operational_state` that is associated with each Pipeline. The value for this state is either `normal`or `incident`, and the Processors in the Pipeline can change their functioning based on the value. For example, the **Sample** Processor can be disabled if `operational_state=incident` so that during the incident, you can have high fidelity data for further analysis.
## Set the Pipeline Operational State
You can change the operational state of a Pipeline manually through the Mezmo Web App, or through the Telemetry Pipelines API.
### Mezmo Web App
You can change the operational state of a Pipeline in the Mezmo Web App by selecting the state in the upper-left corner of the Pipeline Map. The state of the Pipeline is also shown in the Pipeline name, with an orange flag indicating the **Incident** state.
This screenshot shows a Pipeline that, in **Monitoring** mode, drops `Status 200` events, and converts other HTTP Status events to metrics. In **Incident** Mode, the Route Processor sends the full data stream to Mezmo Log Analysis.
## How it Works
Mezmo Responsive Pipelines introduces a state variable `operational_state` that is associated with each Pipeline. The value for this state is either `normal`or `incident`, and the Processors in the Pipeline can change their functioning based on the value. For example, the **Sample** Processor can be disabled if `operational_state=incident` so that during the incident, you can have high fidelity data for further analysis.
## Set the Pipeline Operational State
You can change the operational state of a Pipeline manually through the Mezmo Web App, or through the Telemetry Pipelines API.
### Mezmo Web App
You can change the operational state of a Pipeline in the Mezmo Web App by selecting the state in the upper-left corner of the Pipeline Map. The state of the Pipeline is also shown in the Pipeline name, with an orange flag indicating the **Incident** state.
 You can then use the value of `op_state` in other processors:
```none theme={null}
Route Processor Configuration
You can then use the value of `op_state` in other processors:
```none theme={null}
Route Processor Configuration
 ### API
You can get and set the value of the Pipeline operational state with the Telemetry Pipelines API:
Get the `state_id`:
```bash theme={null}
curl -s --request GET \
--url 'https://api.mezmo.com/v3/pipeline/state-variable' \
-H 'Authorization: Token <
### API
You can get and set the value of the Pipeline operational state with the Telemetry Pipelines API:
Get the `state_id`:
```bash theme={null}
curl -s --request GET \
--url 'https://api.mezmo.com/v3/pipeline/state-variable' \
-H 'Authorization: Token <