> ## Documentation Index
> Fetch the complete documentation index at: https://docs.mezmo.com/llms.txt
> Use this file to discover all available pages before exploring further.
# Understanding Your Data to Optimize It
> Use the Mezmo Data Profiler to analyze streaming telemetry through Message Templates, Field Summaries, and Log Metrics before deciding how to optimize it.
Before you can optimize your data, you need to understand what it contains, and separate the useful data from the noise. Mezmo's Data Profiler feature enables you to get a detailed, granular view of the most common messages in your log data, and add processor components to handle specific message types.
## Create a Data Profile
There are two ways to generate a data profile:
1. As part of the [Mezmo Flow](/telemetry-pipelines/about-mezmo-flow) onboarding process or the Log Volume Reduction pipeline creation process.
2. Through the [Data Profiler Processor](/telemetry-pipelines/data-profiler-processor), which you can set it up as a component within a Pipeline that you build yourself.
## View the Data Profile
Once a Data Profile has been generated for the Source, you can access it through both the Processor itself, and the navigation in the Mezmo Web App.
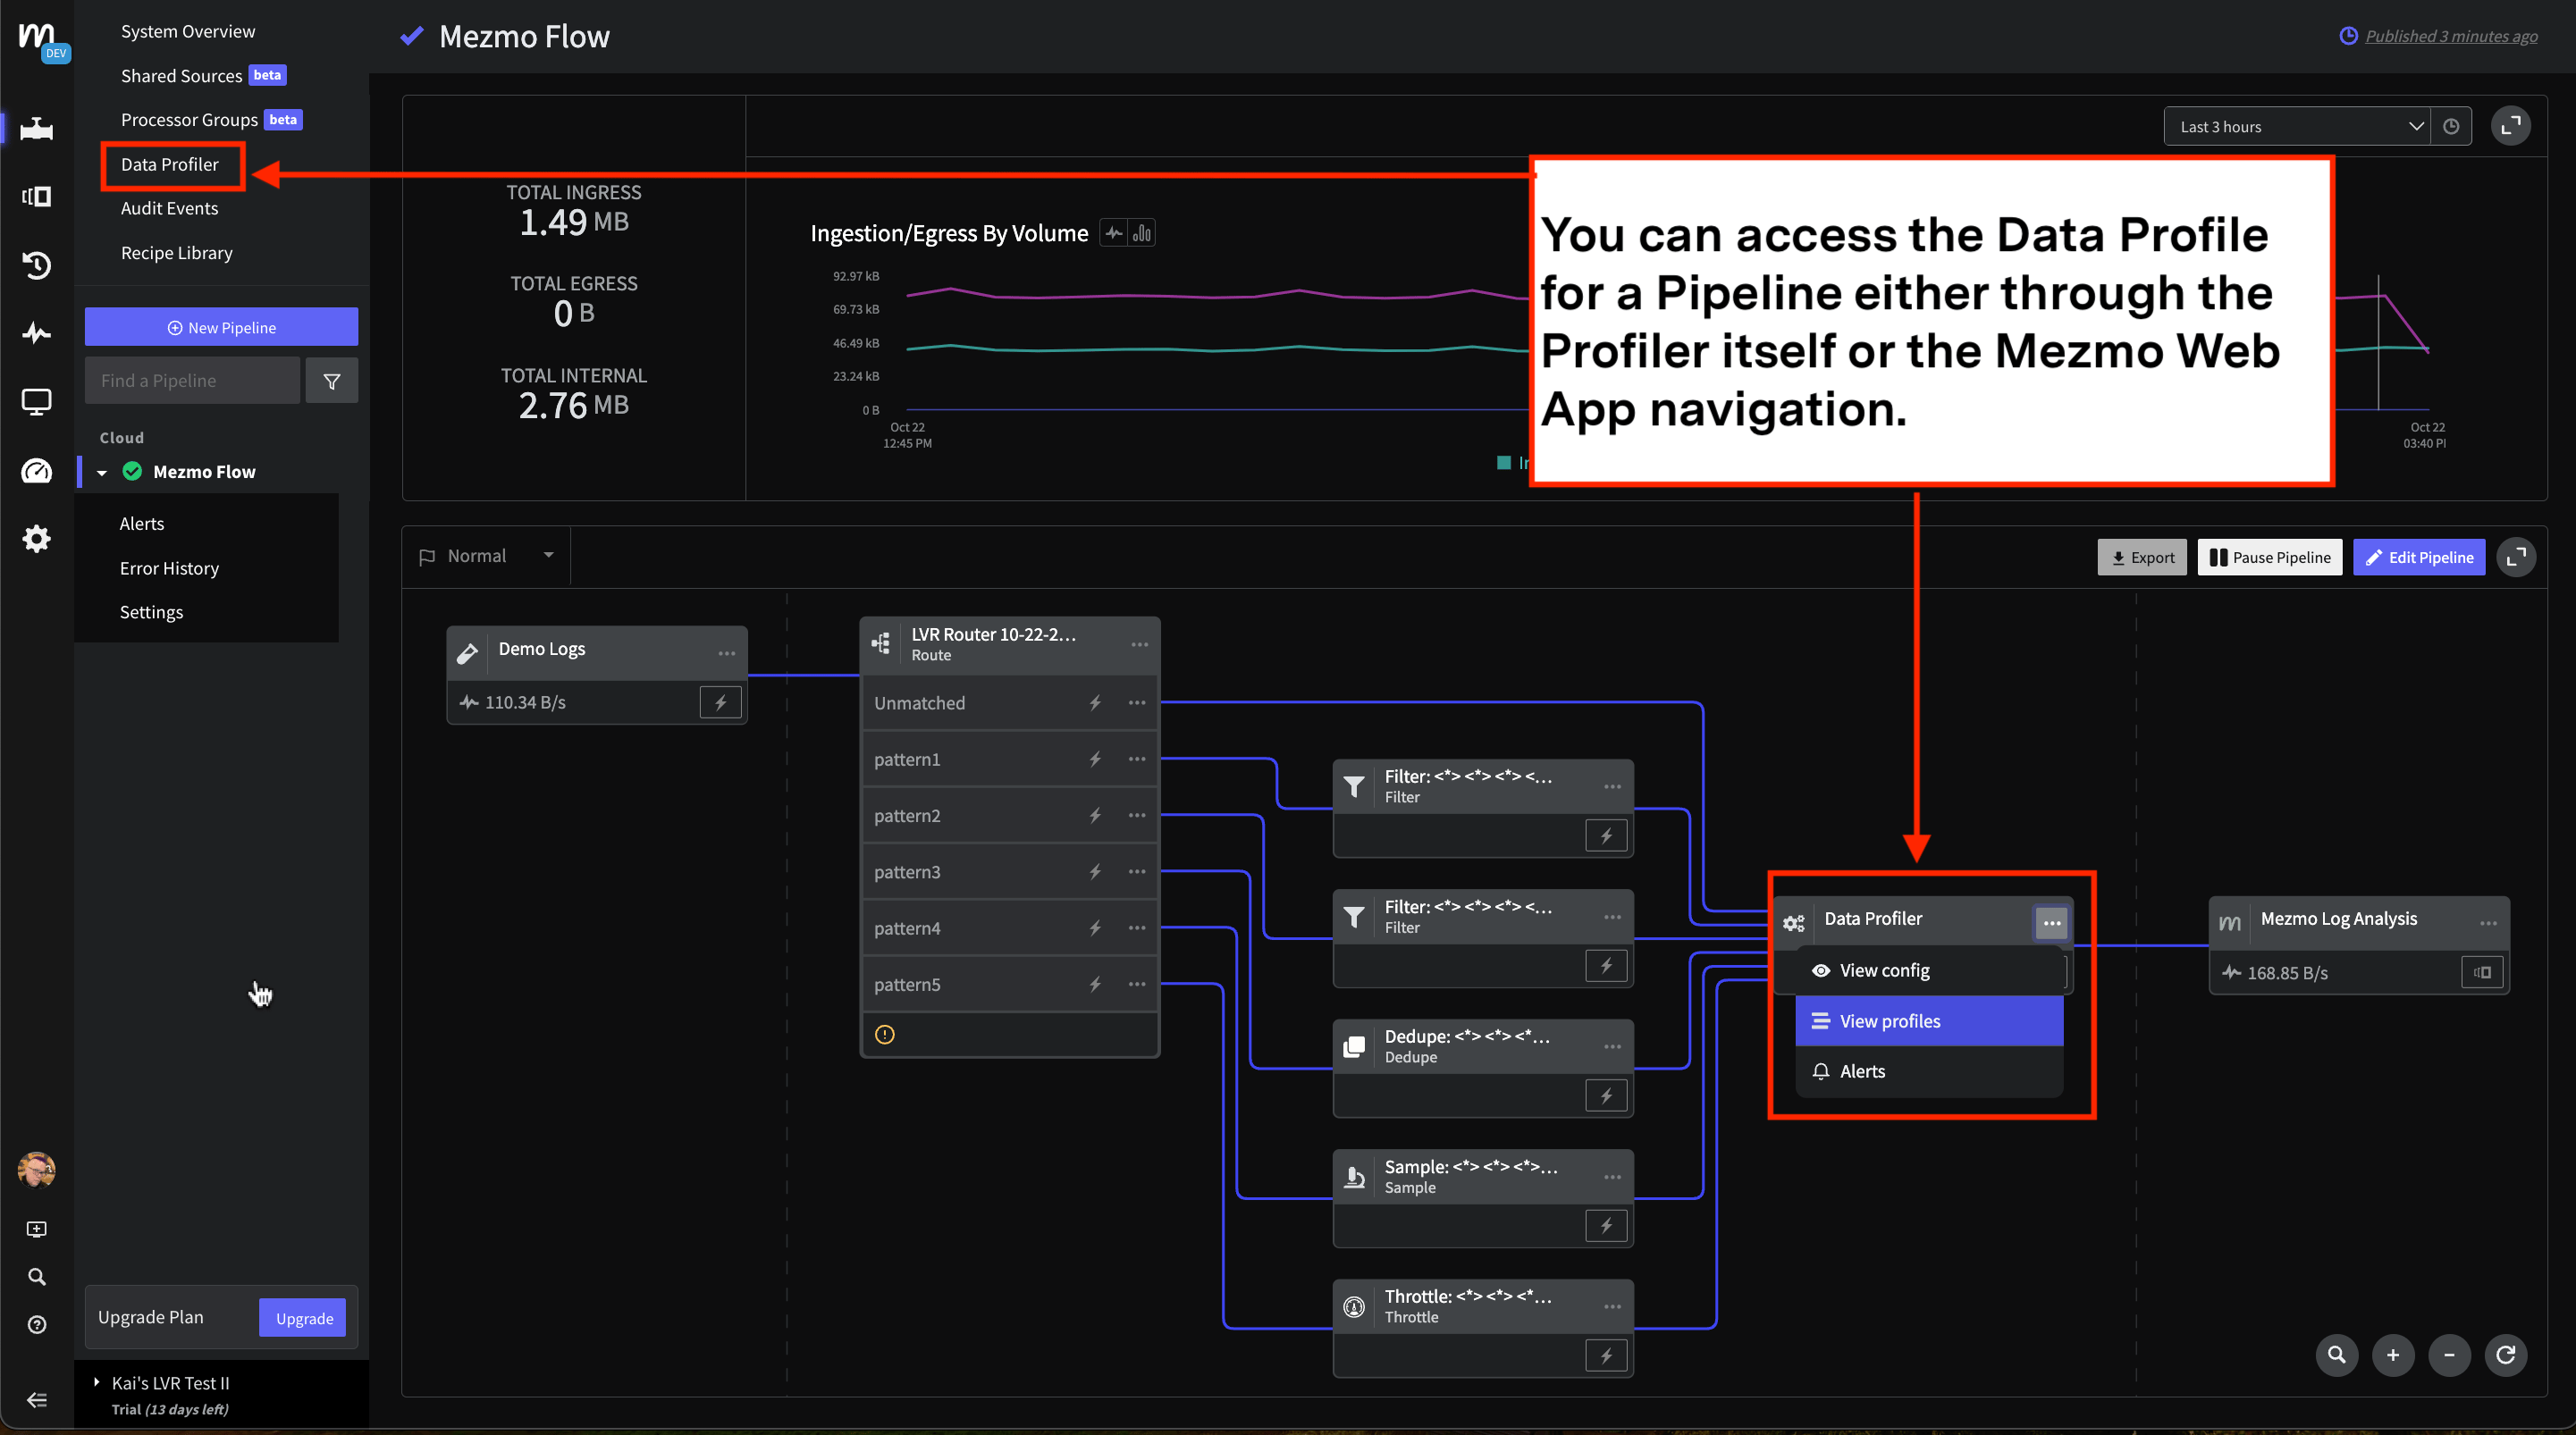 The Data Profiler analyzes streaming telemetry data using multiple techniques so that you can have improved insights based on the type of telemetry data . Analysis of the telemetry is organized in three different tabs in the report: **Message Templates,** **Field Summaries**, and **Log Metrics.**
**Message Templates** provide information on unstructured text messages, where **Field Summaries** provide better insights into structured data such as JSON logs.
### Message Templates
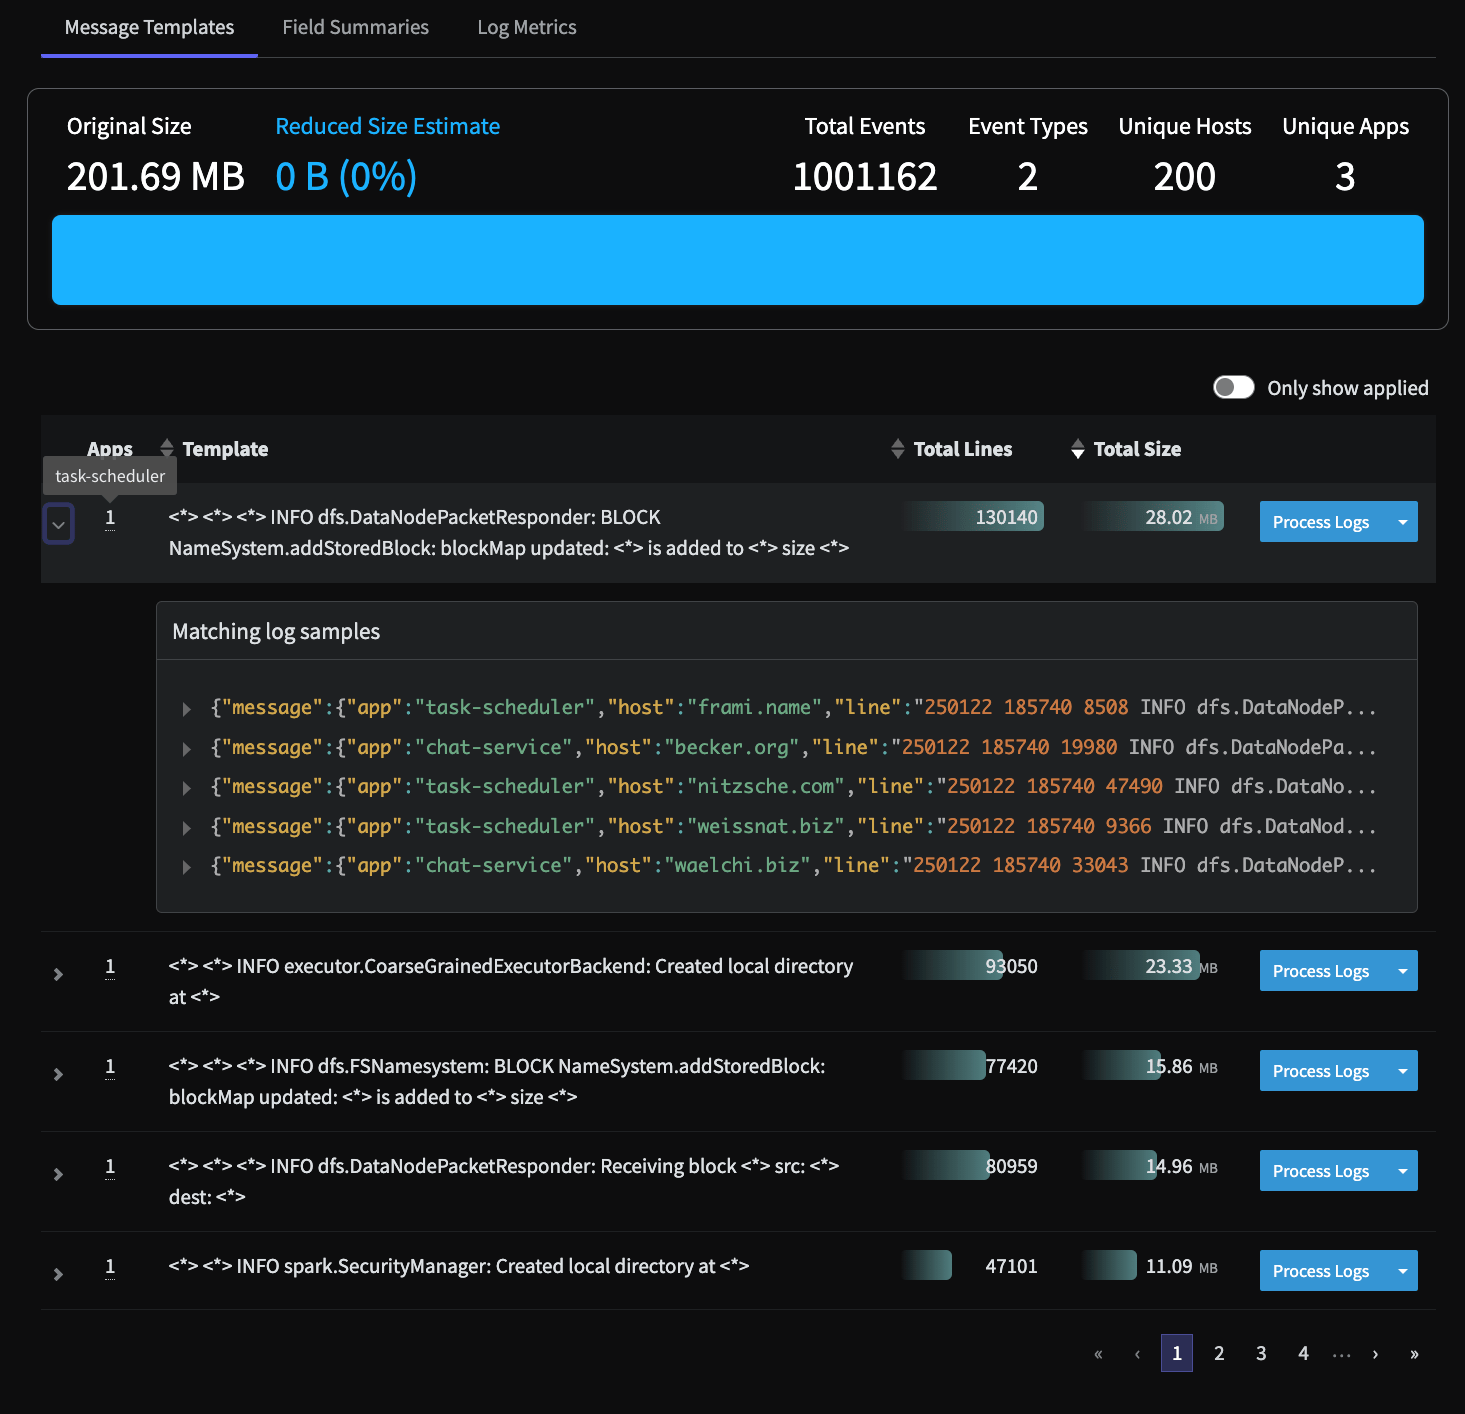
**The Message Templates** section provides a report of log patterns discovered in the data. This enables you to understand how much specific log patterns contribute to the overall source volume, expressed as a percentage of the total data volume. With this information, you can determine if the logs matching the pattern are important for investigation and troubleshooting , or if they are low-value logs that can be archived and don't need to be sent to your observability platform.
The columns in the Message Templates section, which are all sortable, include:
* **Apps,** which shows the number of apps that produced these log patterns. You can hover on the number to see the name of the app(s) that produced the log pattern.
* **Template** shows the tokenized log lines with variables that change from message to message, such as IP or Host, and are replaced by`<*>`
* **Total Lines** shows the number of log lines that match this pattern
* **Total Line Size** shows the sum of all the log lines that match this pattern
You can see examples for each matching log sample by clicking the arrow next for each of the message templates.
The Data Profiler analyzes streaming telemetry data using multiple techniques so that you can have improved insights based on the type of telemetry data . Analysis of the telemetry is organized in three different tabs in the report: **Message Templates,** **Field Summaries**, and **Log Metrics.**
**Message Templates** provide information on unstructured text messages, where **Field Summaries** provide better insights into structured data such as JSON logs.
### Message Templates
**The Message Templates** section provides a report of log patterns discovered in the data. This enables you to understand how much specific log patterns contribute to the overall source volume, expressed as a percentage of the total data volume. With this information, you can determine if the logs matching the pattern are important for investigation and troubleshooting , or if they are low-value logs that can be archived and don't need to be sent to your observability platform.
The columns in the Message Templates section, which are all sortable, include:
* **Apps,** which shows the number of apps that produced these log patterns. You can hover on the number to see the name of the app(s) that produced the log pattern.
* **Template** shows the tokenized log lines with variables that change from message to message, such as IP or Host, and are replaced by`<*>`
* **Total Lines** shows the number of log lines that match this pattern
* **Total Line Size** shows the sum of all the log lines that match this pattern
You can see examples for each matching log sample by clicking the arrow next for each of the message templates.
 ### Field Summaries
This is an experimental feature that is still in development. For access to this feature, reach out to your Customer Support Manager or [support@mezmo.com](mailto:support@mezmo.com).
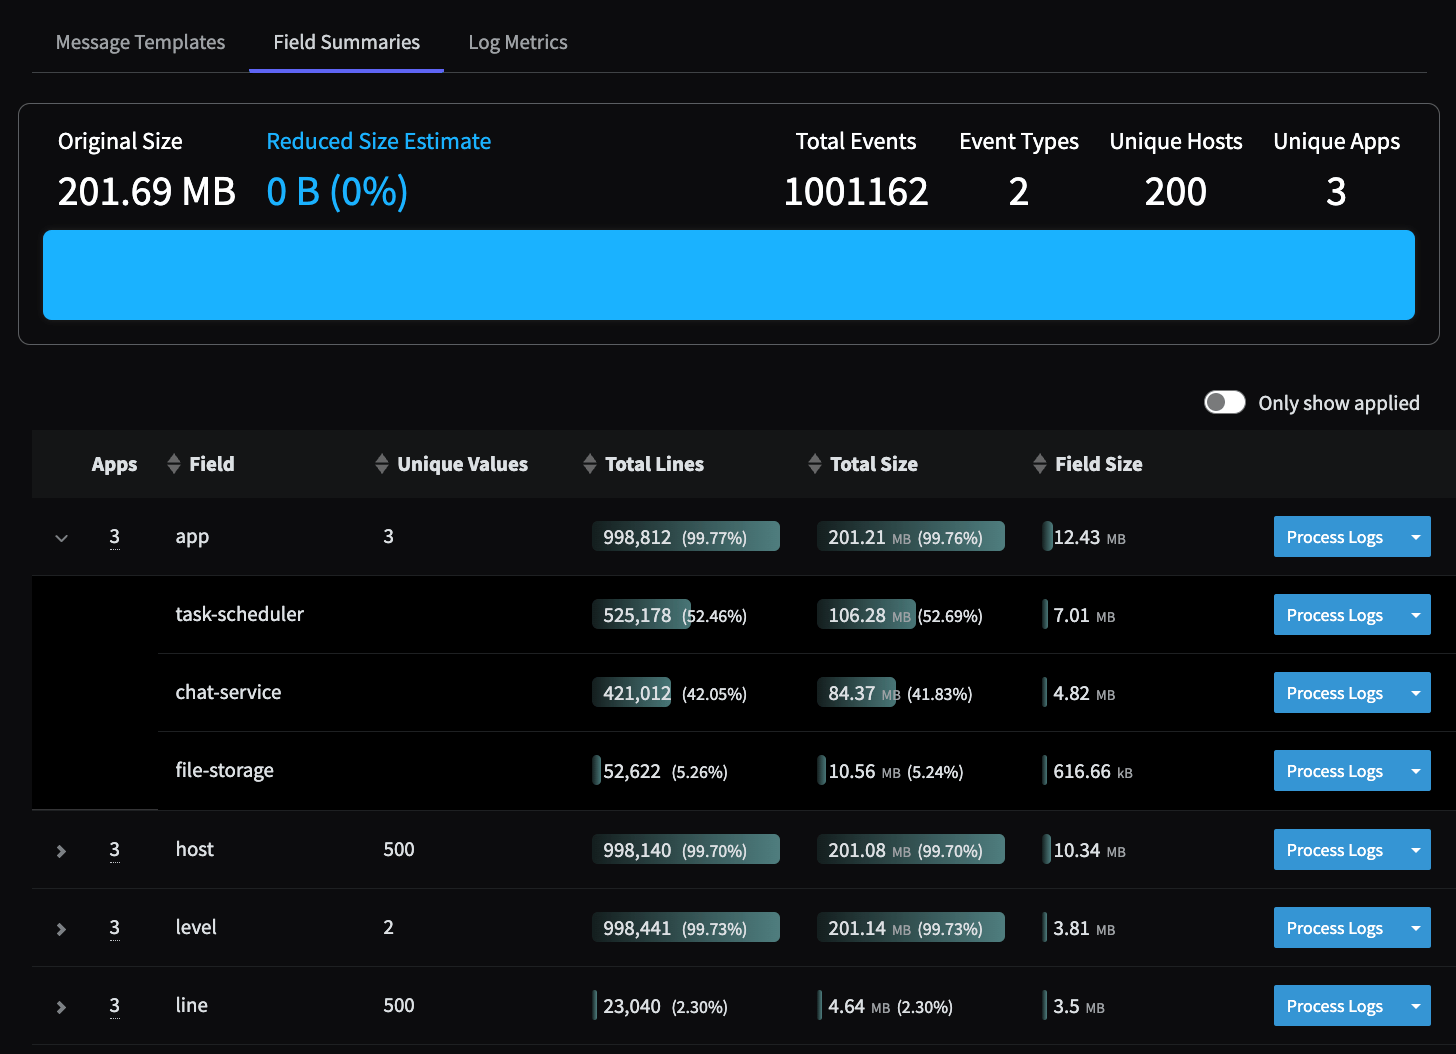
Field summaries provide the analysis of telemetry data from the perspective of field values. The Field Summaries section provides a tabular view of all the Fields discovered from the events that are streaming through the pipeline during a profiler run. Click the arrow next to the field name to see the unique values associated with the field. You can also apply Processors to those unique values.
Within the Field Summaries report, you will see:
| Report Column | Description |
| ----------------- | ------------------------------------------------------------------------------------------------------------------------------------------------------------------------------------------------------------------------------------------------------------------------------------------------------------------------------------------------- |
| **Field Name** | The name of the field. |
| **Unique Values** | Represents the count of the unique values found in all the logs during the profiling run. This indicates the cardinality of the field. Some fields can have a large number of unique values, however, the report will only display the first 500 unique values. The value displayed depends on the type of field, as described in the next table. |
| **Total Lines** | Similar to the message templates, this column shows:
### Field Summaries
This is an experimental feature that is still in development. For access to this feature, reach out to your Customer Support Manager or [support@mezmo.com](mailto:support@mezmo.com).
Field summaries provide the analysis of telemetry data from the perspective of field values. The Field Summaries section provides a tabular view of all the Fields discovered from the events that are streaming through the pipeline during a profiler run. Click the arrow next to the field name to see the unique values associated with the field. You can also apply Processors to those unique values.
Within the Field Summaries report, you will see:
| Report Column | Description |
| ----------------- | ------------------------------------------------------------------------------------------------------------------------------------------------------------------------------------------------------------------------------------------------------------------------------------------------------------------------------------------------- |
| **Field Name** | The name of the field. |
| **Unique Values** | Represents the count of the unique values found in all the logs during the profiling run. This indicates the cardinality of the field. Some fields can have a large number of unique values, however, the report will only display the first 500 unique values. The value displayed depends on the type of field, as described in the next table. |
| **Total Lines** | Similar to the message templates, this column shows:
The number of log events that contain this field.
The percentage of logs that contain this field. The Percentage is calculated based on the total volume of data processed by the profiler during that specific run. |
| **Total Size** | Similar to the message templates, this column shows:
**S**ize of all the events containing this field.
The number of events containing this field. |
| **Field Size** | This represents the volume contributed by the **field itself** as Bytes and % of the total volume. It includes the field name and value. Using this information, you can decide to drop a field if it contains a large amount of data that is not important. |
You can also apply Processors based on **Field** or **Field Value**. At the **Field** level, you can only select Remove Field. At the **Field Value** level, you can apply Processors such as [Filter](/telemetry-pipelines/filter-processor), [Sample Processor](/telemetry-pipelines/sample-processor), [Dedupe Processor](/telemetry-pipelines/dedupe-processor), and [Throttle Processor](/telemetry-pipelines/throttle-processor). If you remove a field at the Field level, the Field Value processors are disabled because they are mutually exclusive.
This table describes the value displayed based on the value type:
| Value Type | Displayed Value |
| ------------- | ------------------------------------------------------------------------------------------------------------------------------------------ |
| **Boolean** | The value itself. |
| **String** | The value itself, up to the first 50 characters. |
| **Array** | The length of the arrays found. For example, `[a, b, c]` is displayed as **3**. |
| **Object** | Each unique value is the set of names of the keys. For example,`{a:1, b:2}` is displayed as **a, b**. |
| **Float** | Displays the min/max/average, no unique values. |
| **Timestamp** | Displays the min/max (no average), no unique values |
| **Integer** | If cardinality is > the threshold (for example, 65), displays min/max/average. If cardinality is \< threshold, displays the unique values. |
 ### Log Metrics
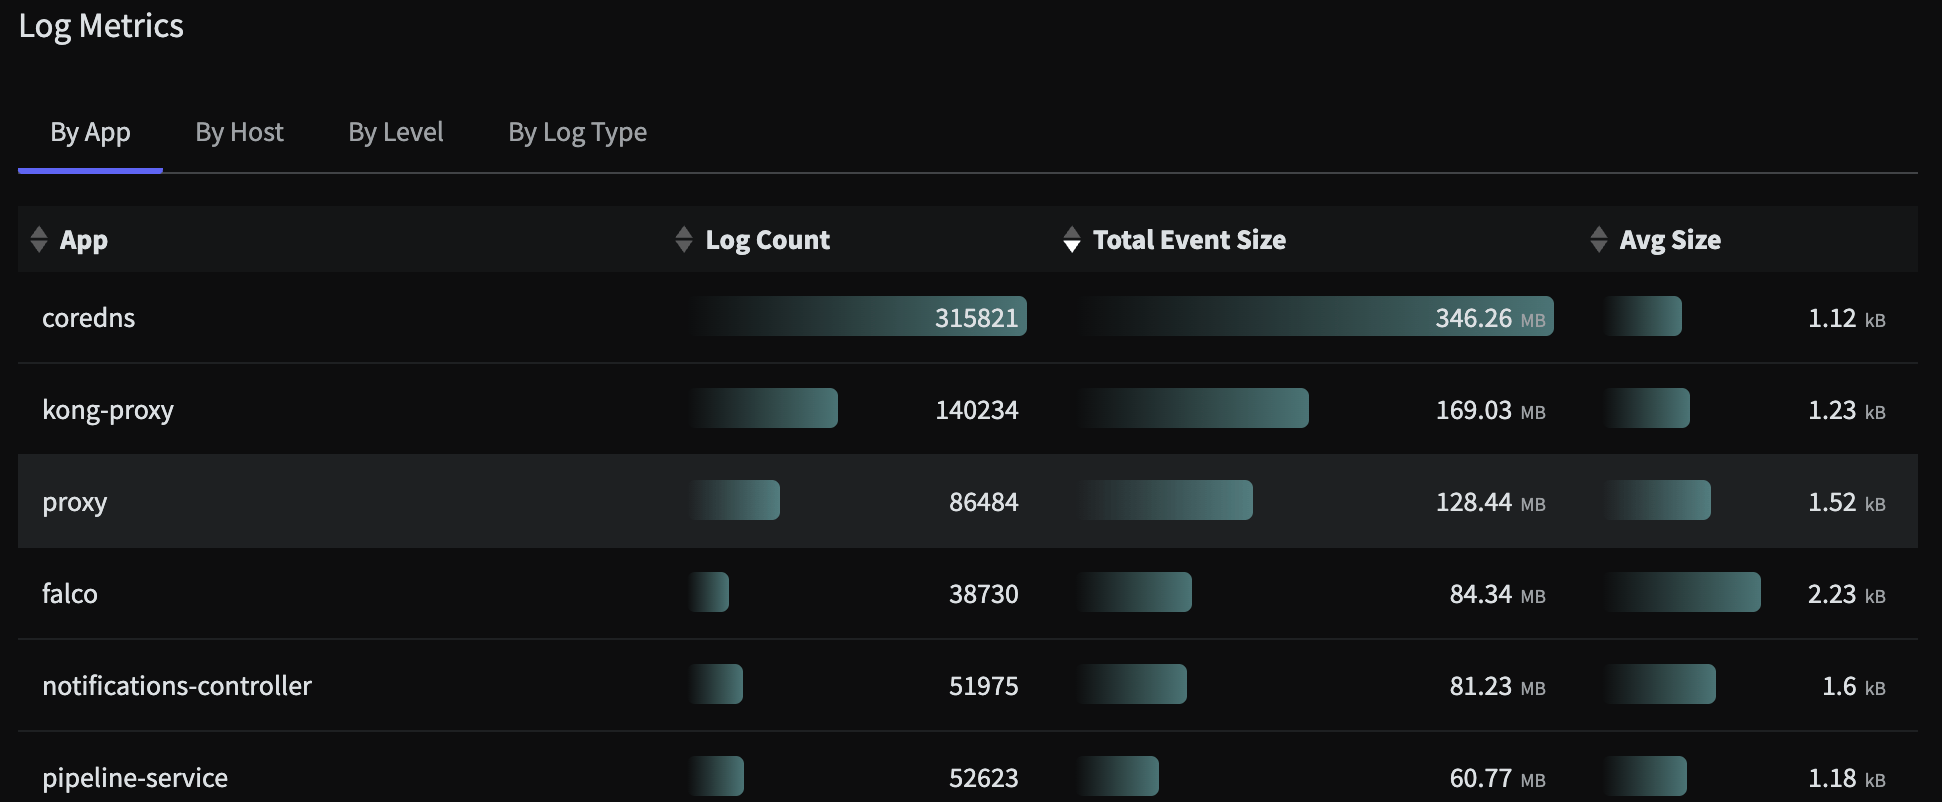
The **Log Metrics** section provides a report of the profiled logs categorized by **App**, **Host**, **Log Level** and **Log Type**:
### Log Metrics
The **Log Metrics** section provides a report of the profiled logs categorized by **App**, **Host**, **Log Level** and **Log Type**:
 ###
###