> ## Documentation Index
> Fetch the complete documentation index at: https://docs.mezmo.com/llms.txt
> Use this file to discover all available pages before exploring further.
# Kubernetes Data Optimization Pipeline
> Transform Kubernetes telemetry into metrics with Filter, Route, Event to Metric, and Aggregate Processors while retaining original data in storage.
## The Situation
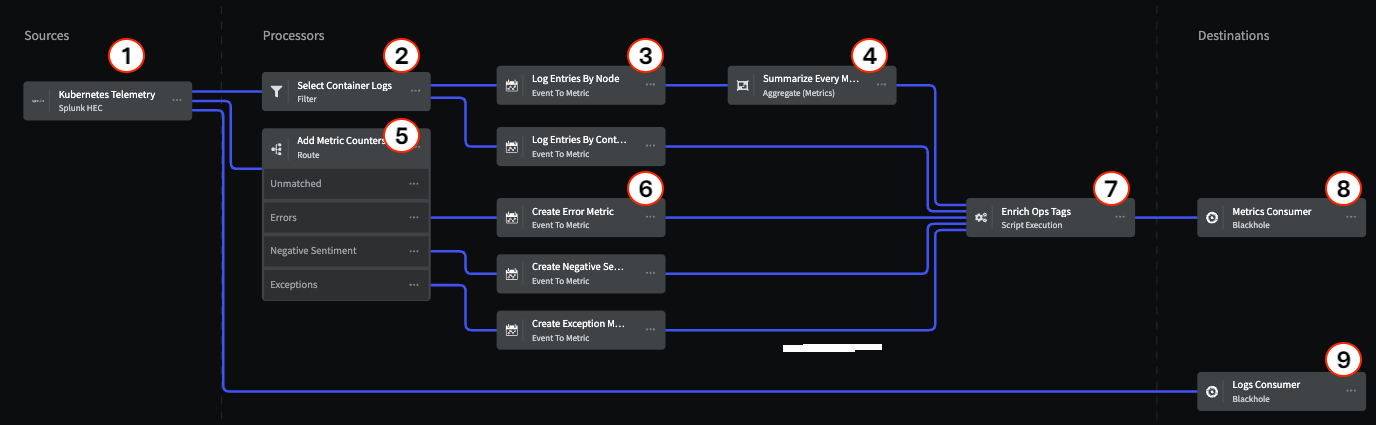
This Pipeline models a typical situation where you have telemetry data originating from a Kubernetes cluster and need to transform it into metric data for consumption by an observability tool, while also retaining a copy of the original data in storage for compliance and later analysis. By using a Pipeline to transform the data as it is streamed, you can reduce the volume of data sent to your tool, and at the same time ensure that data sent to the tool will be optimized to provide useful information.
If you would like to try out this Pipeline with your own Kubernetes data, this topic includes configuration information for each Processor. You can find more detailed information about Mezmo Telemetry Pipelines in [our product guide](/telemetry-pipelines/about-mezmo-telemetry-pipelines). If you don't have a Mezmo account yet, [sign up for a free trial](https://www.mezmo.com/sign-up-pipeline-today) so you can try out our product features and start managing your telemetry data!
## Architecture Overview
 ## Sources
#### 1 Splunk HEC
This Pipeline uses the [Splunk HEC](/telemetry-pipelines/splunk-hec-source) Source as the ingress point for Kubernetes telemetry data, but there are also a variety of [Supported Telemetry Pipeline Sources](/telemetry-pipelines/supported-telemetry-pipeline-sources), including OTel Sources, that you can use.
## Processors
### Container Logs Processing Chain
Nodes 2, 3, and 4 represent the chain for processing Kubernetes container logs.
#### 2 - Filter Processor
The [Filter Processor](/telemetry-pipelines/filter-processor) uses a conditional statement to identify telemetry data specifically related to containers within the Kubernetes cluster, and allows matching data to proceed to the next step of the Processor chain.
```none theme={null}
if (exists(metadata.fields."k8s.container.name"))
```
#### 3 - Event to Metric Processor
The [Event to Metric Processor](/telemetry-pipelines/event-to-metric-processor) converts the Kubernetes events into metrics representing log entries by node, and log entries by container.
| Option | Setting |
| -------------------- | -------------------------------------- |
| Metric Name | l`og_entry_by_node` |
| Kind | `Incremental` |
| Type | `Counter` |
| Value/Value Type | `New value` |
| Value/Value | `1` |
| Namespace/Value Type | `None` |
| Tags/Name | `node_name` |
| Tags/Value Type | `Value from Event Field` |
| Tags/Field Value | `metadata.fields."k8snode.name".field` |
#### 4 - Aggregate Metrics
The [Aggregate Processor](/telemetry-pipelines/aggregate-processor) aggregates multiple metric events into a single metric event based on a defined interval window. In this case, the Processor aggregates all the metric events for the Kubernetes node logs into a single metric over a one minute interval.
| Option | Setting |
| ------------------------------ | ---------------------------- |
| Group by Field Paths | `.name` `.namespace` `.tags` |
| Evaluate/Operation | `add` |
| Window Type/Type | `tumbling` |
| Window Type/Interval (seconds) | `60` |
| Event Timestamp | `.timestamp.field` |
### Metric Counters Processing Chain
Processors 5 and 6 convert log message events of certain types to metrics and produces a count of each type.
#### 5 - Route Processor
The [Route Processor](/telemetry-pipelines/route-processor) uses conditional statements to match log messages related to **Errors**, **Exceptions**, and **Negative Sentiment** (Abort, Broken, Kill, etc.) and sends them to specific Event to Metric Processors.
| Option | Conditional Statement |
| ------------------------ | -------------------------------------------------------------------------------------------------------------------------------------------------------------------------------------------------------------------------------------------------------------------------------------------------------------------------------------------------------------------------------------------------------------------------------------------------------------------------------------------------------- |
| Errors Route | `if (exists(message) AND message contains 'error')` |
| Exceptions Route | `if (exists(message) AND message contains 'exception')` |
| Negative Sentiment Route | `if (exists(message) AND (message contains 'abort' OR message contains 'broken' OR message contains 'caught' OR message contains 'denied' OR message contains 'exception' OR message contains 'fail' OR message contains 'insufficient' OR message contains 'killed' OR message contains 'malformed' OR message contains 'outofmemory' OR message contains 'panic' OR message contains 'timeout' OR message contains 'undefined' OR message contains 'unsuccessful' OR message contains 'unavailable'))` |
#### 6 - Event to Metrics Processors
Each of these processors is used to count the type of message event sent to it, and produce an incremental metric for that type.
**Error Metrics**
| Option | Setting |
| -------------------- | -------------------------------------- |
| Metric Name | `error_monitoring` |
| Kind | `Incremental` |
| Type | `Counter` |
| Value/Value Type | `New value` |
| Value/Value | `1` |
| Namespace/Value Type | `None` |
| Tags/Name | `container_name` |
| Tags/Value Type | `Value from Event Field` |
| Tags/Field Value | `metadata.fields."k8s.container.name"` |
**Negative Sentiment Metrics**
| Option | Setting |
| -------------------- | -------------------------------------- |
| Metric Name | `negative_sentiment_monitoring` |
| Kind | `Incremental` |
| Type | `Counter` |
| Value/Value Type | `New value` |
| Value/Value | `1` |
| Namespace/Value Type | `None` |
| Tags/Name | `container_name` |
| Tags/Value Type | `Value from Event Field` |
| Tags/Field Value | `metadata.fields."k8s.container.name"` |
**Exceptions Metrics**
| Option | Setting |
| -------------------- | -------------------------------------- |
| Metric Name | `exception_monitoring` |
| Kind | `Incremental` |
| Type | `Counter` |
| Value/Value Type | `New value` |
| Value/Value | `1` |
| Namespace/Value Type | `None` |
| Tags/Name | `container_name` |
| Tags/Value Type | `Value from Event Field` |
| Tags/Field Value | `metadata.fields."k8s.container.name"` |
#### 7 - Enrich Ops Tags
All the processed data is sent to the final Processor in the chain, the [Script Execution Processor](/telemetry-pipelines/js-script-processor), which adds descriptive information to the data to identify where and how it was processed.
```bash theme={null}
// Modify the event using a subset of the JavaScript language.
// The function must return the modified event
function processEvent(message, metadata) {
message.tags.pipeline_owner = ''
message.tags.pipeline_name = ''
message.tags.pipeline_url = '
## Sources
#### 1 Splunk HEC
This Pipeline uses the [Splunk HEC](/telemetry-pipelines/splunk-hec-source) Source as the ingress point for Kubernetes telemetry data, but there are also a variety of [Supported Telemetry Pipeline Sources](/telemetry-pipelines/supported-telemetry-pipeline-sources), including OTel Sources, that you can use.
## Processors
### Container Logs Processing Chain
Nodes 2, 3, and 4 represent the chain for processing Kubernetes container logs.
#### 2 - Filter Processor
The [Filter Processor](/telemetry-pipelines/filter-processor) uses a conditional statement to identify telemetry data specifically related to containers within the Kubernetes cluster, and allows matching data to proceed to the next step of the Processor chain.
```none theme={null}
if (exists(metadata.fields."k8s.container.name"))
```
#### 3 - Event to Metric Processor
The [Event to Metric Processor](/telemetry-pipelines/event-to-metric-processor) converts the Kubernetes events into metrics representing log entries by node, and log entries by container.
| Option | Setting |
| -------------------- | -------------------------------------- |
| Metric Name | l`og_entry_by_node` |
| Kind | `Incremental` |
| Type | `Counter` |
| Value/Value Type | `New value` |
| Value/Value | `1` |
| Namespace/Value Type | `None` |
| Tags/Name | `node_name` |
| Tags/Value Type | `Value from Event Field` |
| Tags/Field Value | `metadata.fields."k8snode.name".field` |
#### 4 - Aggregate Metrics
The [Aggregate Processor](/telemetry-pipelines/aggregate-processor) aggregates multiple metric events into a single metric event based on a defined interval window. In this case, the Processor aggregates all the metric events for the Kubernetes node logs into a single metric over a one minute interval.
| Option | Setting |
| ------------------------------ | ---------------------------- |
| Group by Field Paths | `.name` `.namespace` `.tags` |
| Evaluate/Operation | `add` |
| Window Type/Type | `tumbling` |
| Window Type/Interval (seconds) | `60` |
| Event Timestamp | `.timestamp.field` |
### Metric Counters Processing Chain
Processors 5 and 6 convert log message events of certain types to metrics and produces a count of each type.
#### 5 - Route Processor
The [Route Processor](/telemetry-pipelines/route-processor) uses conditional statements to match log messages related to **Errors**, **Exceptions**, and **Negative Sentiment** (Abort, Broken, Kill, etc.) and sends them to specific Event to Metric Processors.
| Option | Conditional Statement |
| ------------------------ | -------------------------------------------------------------------------------------------------------------------------------------------------------------------------------------------------------------------------------------------------------------------------------------------------------------------------------------------------------------------------------------------------------------------------------------------------------------------------------------------------------- |
| Errors Route | `if (exists(message) AND message contains 'error')` |
| Exceptions Route | `if (exists(message) AND message contains 'exception')` |
| Negative Sentiment Route | `if (exists(message) AND (message contains 'abort' OR message contains 'broken' OR message contains 'caught' OR message contains 'denied' OR message contains 'exception' OR message contains 'fail' OR message contains 'insufficient' OR message contains 'killed' OR message contains 'malformed' OR message contains 'outofmemory' OR message contains 'panic' OR message contains 'timeout' OR message contains 'undefined' OR message contains 'unsuccessful' OR message contains 'unavailable'))` |
#### 6 - Event to Metrics Processors
Each of these processors is used to count the type of message event sent to it, and produce an incremental metric for that type.
**Error Metrics**
| Option | Setting |
| -------------------- | -------------------------------------- |
| Metric Name | `error_monitoring` |
| Kind | `Incremental` |
| Type | `Counter` |
| Value/Value Type | `New value` |
| Value/Value | `1` |
| Namespace/Value Type | `None` |
| Tags/Name | `container_name` |
| Tags/Value Type | `Value from Event Field` |
| Tags/Field Value | `metadata.fields."k8s.container.name"` |
**Negative Sentiment Metrics**
| Option | Setting |
| -------------------- | -------------------------------------- |
| Metric Name | `negative_sentiment_monitoring` |
| Kind | `Incremental` |
| Type | `Counter` |
| Value/Value Type | `New value` |
| Value/Value | `1` |
| Namespace/Value Type | `None` |
| Tags/Name | `container_name` |
| Tags/Value Type | `Value from Event Field` |
| Tags/Field Value | `metadata.fields."k8s.container.name"` |
**Exceptions Metrics**
| Option | Setting |
| -------------------- | -------------------------------------- |
| Metric Name | `exception_monitoring` |
| Kind | `Incremental` |
| Type | `Counter` |
| Value/Value Type | `New value` |
| Value/Value | `1` |
| Namespace/Value Type | `None` |
| Tags/Name | `container_name` |
| Tags/Value Type | `Value from Event Field` |
| Tags/Field Value | `metadata.fields."k8s.container.name"` |
#### 7 - Enrich Ops Tags
All the processed data is sent to the final Processor in the chain, the [Script Execution Processor](/telemetry-pipelines/js-script-processor), which adds descriptive information to the data to identify where and how it was processed.
```bash theme={null}
// Modify the event using a subset of the JavaScript language.
// The function must return the modified event
function processEvent(message, metadata) {
message.tags.pipeline_owner = ''
message.tags.pipeline_name = ''
message.tags.pipeline_url = '