> ## Documentation Index
> Fetch the complete documentation index at: https://docs.mezmo.com/llms.txt
> Use this file to discover all available pages before exploring further.
# Kafka Data Optimization Pipeline
> Parse, route, and convert Kafka logs to metrics so routine events are summarized while errors and warnings reach storage at full fidelity.
**Estimated Reading Time**: 5 minutes
## The Situation
Applications today are often composed of many different components to create a "stack." Each part of the stack is important to the function of the application, but not every part behaves the same way. Open source components like Kafka can generate a substantial volume of logs. Many of the logs can provide valuable operational data in real time needed to understand the application behavior, while others are less relevant and can be sent to storage for later analysis.
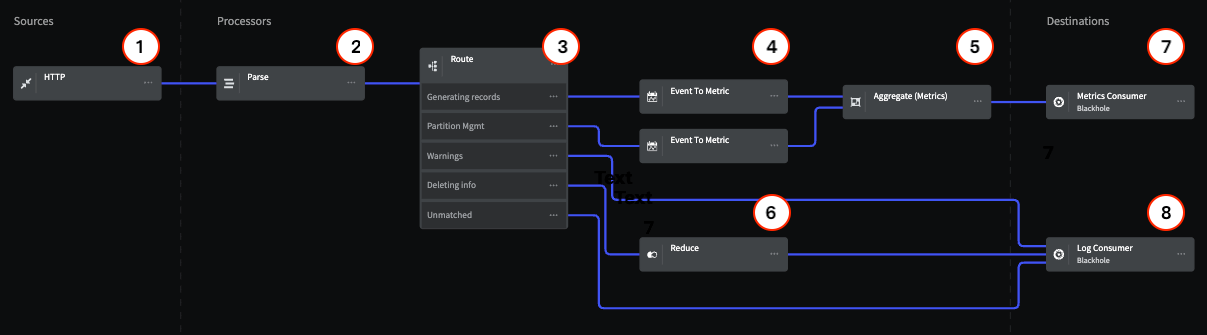
This Pipeline provides a model for optimizing your log data based on the most common log messages that would be generated from a Kafka cluster, but is also an example of how to create a Pipeline to optimize data from any other system that generates similar log data. This architecture includes [standard best practices](/practioner-guide-data-optimization/optimize-your-observability-data-in-six-steps) such as removing extraneous events from the stream, routing data to specific destinations based on the event type, and converting events to metrics for use in operational dashboards.
For Kafka data, the log types we identified that can be easily optimized include **partition management**, **record generation**, and **deletion** information. These log types can be either summarized or rolled into metrics for monitoring without needing additional storage space. **Errors** and **Warnings** are given direct paths to storage and left untouched for full fidelity.
## Architecture Overview
 ### Sources
#### 1 - HTTP Endpoint
For this example, the [HTTP Endpoint](/telemetry-pipelines/http-destination) Source includes a data sample that represents Kafka logs. We are using this source because it can accept any log data via an HTTP post request. In practice, you may be using an Agent of some kind, but the same principles apply.
### Processors
#### 2 - Parse
The [Parse Processor](/telemetry-pipelines/parse-processor) uses a [Grok Pattern](/telemetry-pipelines/using-grok-to-parse) to parse the Kafka logs that the Pipeline will process and standardize their data format. Note that Mezmo has custom Grok expressions, including `%{SQUARE_BRACKET}` , which is used in this example for convenience.
```none theme={null}
%{SQUARE_BRACKET}%{TIMESTAMP_ISO8601:timestamp}%{SQUARE_BRACKET} %{LOGLEVEL:level} %{GREEDYDATA:description}
```
#### 3 - Route
The [Route Processor](/telemetry-pipelines/route-processor) uses conditional statements to match log data and provide flow control that separates the data for the Metrics and Log Consumer destinations.
**Generating Records Route**
This statement matches the terms `generating` and `generated` in the `.description` field of the data, and routes it to an [Event to Metric Processor](/telemetry-pipelines/event-to-metric-processor).
```none theme={null}
if (.description contains 'generating' OR .description contains 'generated')
```
**Partition Management**
This statement matches the term partition in the `.description` field of the data, and routes it to an [Event to Metric Processor](/telemetry-pipelines/event-to-metric-processor).
```none theme={null}
if (.description contains 'partition')
```
**Error and Warnings**
This statement matches the terms `warn` and `error` in the .`level` field of the data, and routes it directly the Log Consumer destination.
```none theme={null}
if (.level equal 'warn' OR 'error')
```
Critical events, like errors and warnings, should be routed directly to storage or your log analysis system to preserve full-fidelity copies for later analysis. If the warnings are especially verbose, you could also convert them to metrics based on your specific needs.
**Deleting info**
This statement matches the term `deleted` in the .`description` field of the data, and routes it to the [Reduce Processor](/telemetry-pipelines/reduce-processor).
```none theme={null}
if (.description contains 'deleted')
```
**Unmatched**
Any data that doesn't match the conditional statements is routed directly to the Log Consumer destination.
#### 4 - Event to Metric
The two [Event to Metric Processor](/telemetry-pipelines/event-to-metric-processor)s are set to take the incoming log events and convert them to metrics, then sends the converted metrics to the [Aggregate Processor](/telemetry-pipelines/aggregate-processor)
The configuration of these Processors represents the best practice of reducing repetitive events, like the start and stop of processes, to metrics. The valuable information in these events isn't within the single event itself, but in the total number of operations and the load they place on your systems. The same is true of positive events, like `200-OK` messages. By converting these types of events to metrics, your Pipeline can provide you with useful information while also substantially reducing the volumes of data you send to your monitoring systems.
**Generating Records**
This Processor creates a counter metric for each event with `generating` or `generated` in the `.description` field, and creates an incremental count starting at 1.
**Partition Management**
This Processor creates a counter metric for each event with `partition` in the `.description` field, and creates an incremental count starting at 1.
#### 5 - Aggregate (Metric)
The [Aggregate Processor](/telemetry-pipelines/aggregate-processor) converts the metric counts from the Event to Metric Processor to an aggregated metric based on a count of events over 10 second intervals.
When setting time intervals for the **Aggregate** and **Reduce** Processors, you should consider how faithful you need to be to the original data to get the information you need. As a rule of thumb:
**30 seconds+** for low fidelity needs, ensuring positive affirmations
**10 seconds** for medium fidelity needs
**1 second** for high fidelity
**\< 1 second** for very high fidelity
#### 6 - Reduce
Similar to the Event to Metric Processors, the [Reduce Processor](/telemetry-pipelines/reduce-processor) converts the `deleted` events sent to it from the Route Processor into a single event based on an interval of 30 seconds, and appends this as an array to the .description field for consumption by the Log Consumer.
### Destinations
For purposes of this example, this Pipeline terminates in two [Blackhole](/telemetry-pipelines/blackhole-destination) destinations. All data sent to a Black Hole is dropped for the purpose counting against your egress volume. This lets you construct a Pipeline and make sure that the data being sent to each destination is in the desired state before sending it to your production systems. In this example, the Blackholes represent two typical destinations for operational information, one that consumes metric data, and another that consumes log/event data.
### Sources
#### 1 - HTTP Endpoint
For this example, the [HTTP Endpoint](/telemetry-pipelines/http-destination) Source includes a data sample that represents Kafka logs. We are using this source because it can accept any log data via an HTTP post request. In practice, you may be using an Agent of some kind, but the same principles apply.
### Processors
#### 2 - Parse
The [Parse Processor](/telemetry-pipelines/parse-processor) uses a [Grok Pattern](/telemetry-pipelines/using-grok-to-parse) to parse the Kafka logs that the Pipeline will process and standardize their data format. Note that Mezmo has custom Grok expressions, including `%{SQUARE_BRACKET}` , which is used in this example for convenience.
```none theme={null}
%{SQUARE_BRACKET}%{TIMESTAMP_ISO8601:timestamp}%{SQUARE_BRACKET} %{LOGLEVEL:level} %{GREEDYDATA:description}
```
#### 3 - Route
The [Route Processor](/telemetry-pipelines/route-processor) uses conditional statements to match log data and provide flow control that separates the data for the Metrics and Log Consumer destinations.
**Generating Records Route**
This statement matches the terms `generating` and `generated` in the `.description` field of the data, and routes it to an [Event to Metric Processor](/telemetry-pipelines/event-to-metric-processor).
```none theme={null}
if (.description contains 'generating' OR .description contains 'generated')
```
**Partition Management**
This statement matches the term partition in the `.description` field of the data, and routes it to an [Event to Metric Processor](/telemetry-pipelines/event-to-metric-processor).
```none theme={null}
if (.description contains 'partition')
```
**Error and Warnings**
This statement matches the terms `warn` and `error` in the .`level` field of the data, and routes it directly the Log Consumer destination.
```none theme={null}
if (.level equal 'warn' OR 'error')
```
Critical events, like errors and warnings, should be routed directly to storage or your log analysis system to preserve full-fidelity copies for later analysis. If the warnings are especially verbose, you could also convert them to metrics based on your specific needs.
**Deleting info**
This statement matches the term `deleted` in the .`description` field of the data, and routes it to the [Reduce Processor](/telemetry-pipelines/reduce-processor).
```none theme={null}
if (.description contains 'deleted')
```
**Unmatched**
Any data that doesn't match the conditional statements is routed directly to the Log Consumer destination.
#### 4 - Event to Metric
The two [Event to Metric Processor](/telemetry-pipelines/event-to-metric-processor)s are set to take the incoming log events and convert them to metrics, then sends the converted metrics to the [Aggregate Processor](/telemetry-pipelines/aggregate-processor)
The configuration of these Processors represents the best practice of reducing repetitive events, like the start and stop of processes, to metrics. The valuable information in these events isn't within the single event itself, but in the total number of operations and the load they place on your systems. The same is true of positive events, like `200-OK` messages. By converting these types of events to metrics, your Pipeline can provide you with useful information while also substantially reducing the volumes of data you send to your monitoring systems.
**Generating Records**
This Processor creates a counter metric for each event with `generating` or `generated` in the `.description` field, and creates an incremental count starting at 1.
**Partition Management**
This Processor creates a counter metric for each event with `partition` in the `.description` field, and creates an incremental count starting at 1.
#### 5 - Aggregate (Metric)
The [Aggregate Processor](/telemetry-pipelines/aggregate-processor) converts the metric counts from the Event to Metric Processor to an aggregated metric based on a count of events over 10 second intervals.
When setting time intervals for the **Aggregate** and **Reduce** Processors, you should consider how faithful you need to be to the original data to get the information you need. As a rule of thumb:
**30 seconds+** for low fidelity needs, ensuring positive affirmations
**10 seconds** for medium fidelity needs
**1 second** for high fidelity
**\< 1 second** for very high fidelity
#### 6 - Reduce
Similar to the Event to Metric Processors, the [Reduce Processor](/telemetry-pipelines/reduce-processor) converts the `deleted` events sent to it from the Route Processor into a single event based on an interval of 30 seconds, and appends this as an array to the .description field for consumption by the Log Consumer.
### Destinations
For purposes of this example, this Pipeline terminates in two [Blackhole](/telemetry-pipelines/blackhole-destination) destinations. All data sent to a Black Hole is dropped for the purpose counting against your egress volume. This lets you construct a Pipeline and make sure that the data being sent to each destination is in the desired state before sending it to your production systems. In this example, the Blackholes represent two typical destinations for operational information, one that consumes metric data, and another that consumes log/event data.