> ## Documentation Index
> Fetch the complete documentation index at: https://docs.mezmo.com/llms.txt
> Use this file to discover all available pages before exploring further.
# Basic Log Analysis Pipeline
> Configure and use the Mezmo Log Analysis Destination with a Demo Logs Source to stream telemetry data into the Log Analysis viewer.
When you sign up for a trial account for the Mezmo Platform, you automatically have access to all the features of Mezmo Telemetry Pipelines. To get access to Log Analysis features, you need to add the [Mezmo Log Analysis Destination ](/telemetry-pipelines/mezmo-destination) to your Pipeline. This topic will show you how to configure and use the Log Analysis Destination with a [Demo Logs Source](/telemetry-pipelines/demo-logs-source).
## Pipeline Architecture
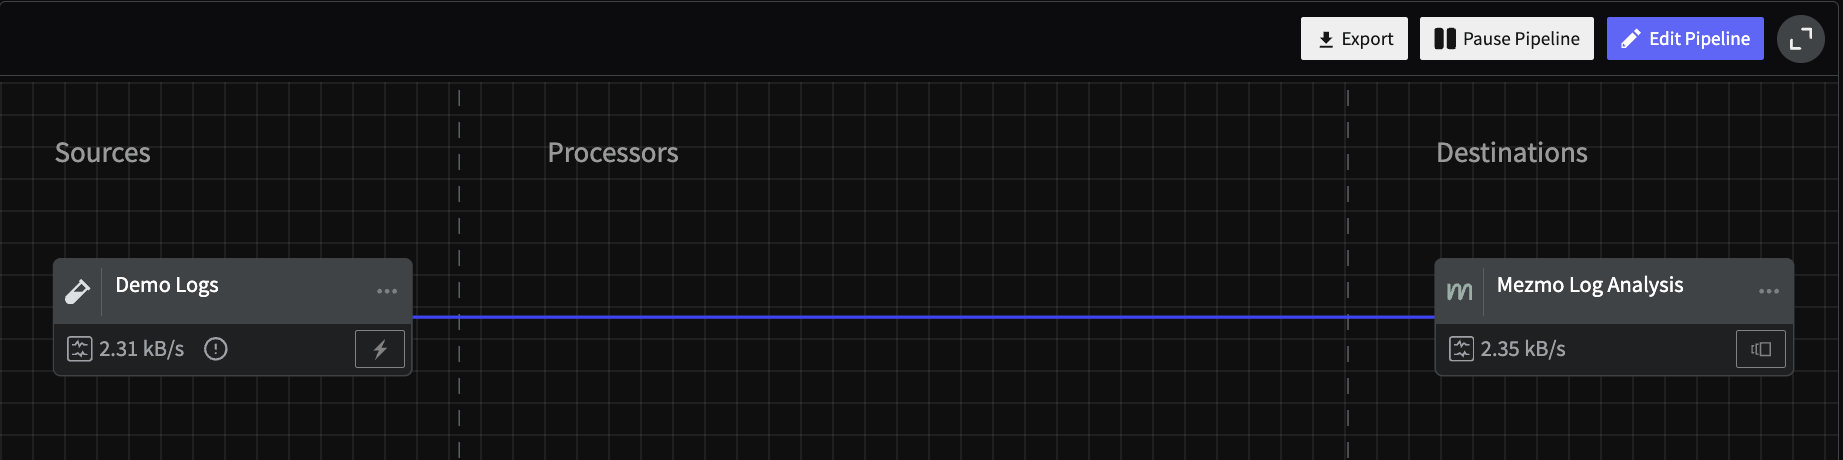
This schematic illustrates a basic architecture in which an ingestion source sends telemetry data directly to Mezmo Log Analysis. You would typically have other Processors in the Pipeline to optimize the data to your requirements for Log Analysis, but for demo purposes this Pipeline includes only the Source and Destination.
 ## Build a Basic Log Analysis Pipeline
1. Log in to the [Mezmo Web App](https://app.mezmo.com).
2. Click the **Pipelines** icon in the left-hand navigation.
3. Click **New Pipeline**.
4. Enter a **Name** for the Pipeline, and select **Create a Blank Pipeline**.
5. In the Pipeline Map, click **Add Source**, and select **Demo Logs**.
6. In the Demo Logs configuration panel, use the default settings for **Interval** (1) and **Format** (HTTP JSON).
7. In the Pipeline Map, click **Add Destination** and select **Mezmo Log Analysis**.
8. In the Mezmo Log Analysis configuration panel, use the default settings, then click **Close**.
9. In the Mezmo Log Analysis configuration panel, click **Generate New Ingestion Key,** then click **Close.**
10. Click Deploy Pipeline. You will see the data begin to flow from the Demo Source into Log Analysis in the **Ingestion/Egress by Volume** chart at the top of the Pipeline Map.
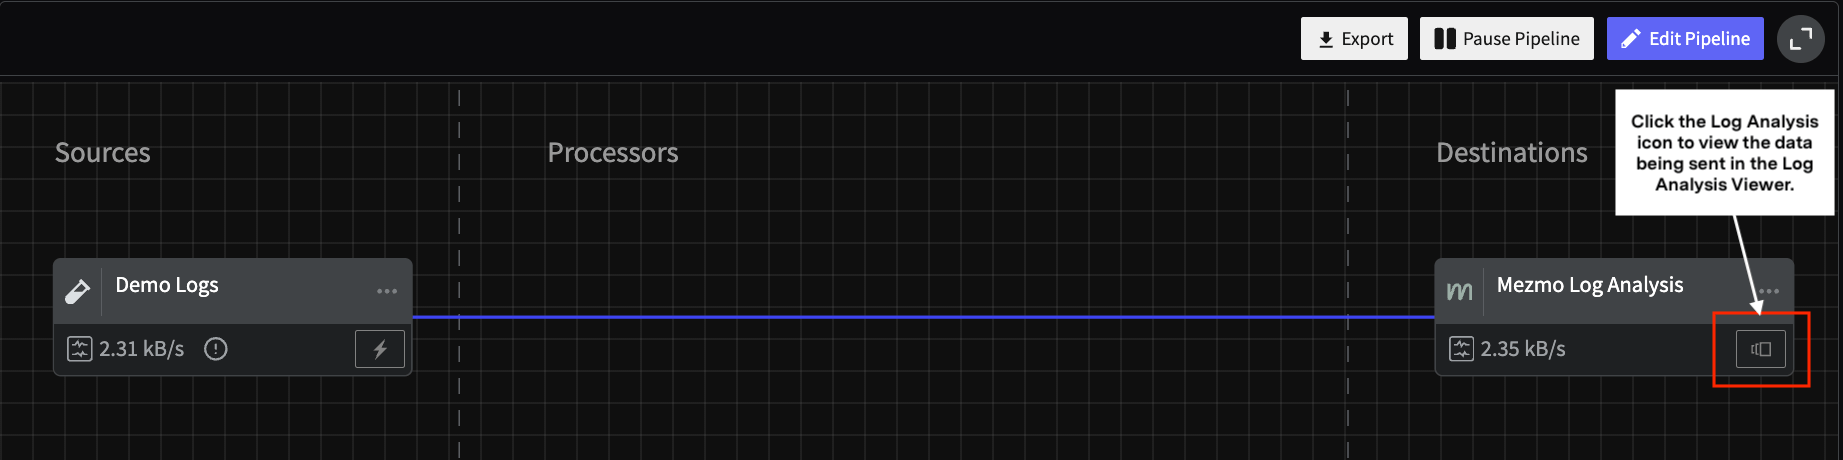
11. To view the data in Mezmo Log Analysis, click the **Log Analysis** icon in the lower-right corner of the Mezmo Log Analysis destination node. This will launch the Log Analysis Viewer, and you will begin to see data streaming into the viewer. You will also see Log Analysis features such as **Boards**, **Screens**, and **Views** added to the left-hand navigation.
## Build a Basic Log Analysis Pipeline
1. Log in to the [Mezmo Web App](https://app.mezmo.com).
2. Click the **Pipelines** icon in the left-hand navigation.
3. Click **New Pipeline**.
4. Enter a **Name** for the Pipeline, and select **Create a Blank Pipeline**.
5. In the Pipeline Map, click **Add Source**, and select **Demo Logs**.
6. In the Demo Logs configuration panel, use the default settings for **Interval** (1) and **Format** (HTTP JSON).
7. In the Pipeline Map, click **Add Destination** and select **Mezmo Log Analysis**.
8. In the Mezmo Log Analysis configuration panel, use the default settings, then click **Close**.
9. In the Mezmo Log Analysis configuration panel, click **Generate New Ingestion Key,** then click **Close.**
10. Click Deploy Pipeline. You will see the data begin to flow from the Demo Source into Log Analysis in the **Ingestion/Egress by Volume** chart at the top of the Pipeline Map.
11. To view the data in Mezmo Log Analysis, click the **Log Analysis** icon in the lower-right corner of the Mezmo Log Analysis destination node. This will launch the Log Analysis Viewer, and you will begin to see data streaming into the viewer. You will also see Log Analysis features such as **Boards**, **Screens**, and **Views** added to the left-hand navigation.