> ## Documentation Index
> Fetch the complete documentation index at: https://docs.mezmo.com/llms.txt
> Use this file to discover all available pages before exploring further.
# 7 - Create an OTel Trace Handle Pipeline
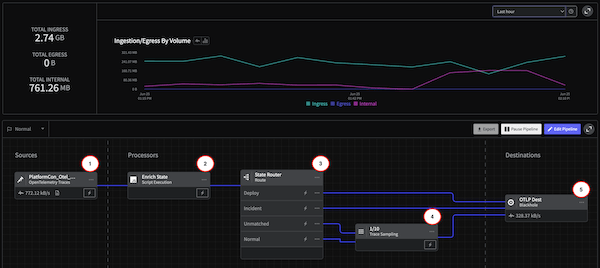
> Build a pipeline that samples OpenTelemetry traces during normal operation and routes data by operational state.
If you run into any issues or have feedback on either the workshop or Pipeline, please reach out to us at [support@mezmo.com](mailto:support@mezmo.com).
In this step you will create a pipeline to handle OpenTelemetry Traces.
## Pipeline Architecture
 ## 1 - Create the Pipeline and Add the Source
1. In the Mezmo Web app, click **New Pipeline** and name it `Trace Handler`.
2. In the Pipeline Map, click **Add Source**, then select the OpenTelemetry Trace source you created in Step 2.
## 2 - Add State Variables
A responsive pipeline changes its functioning based on detection of state changes. For this example, you will use the [Script Execution Processor](/telemetry-pipelines/js-script-processor) to add variables to the data that indicate the operational state of the pipeline.
1. Click the `...`menu in the upper-right corner of the OpenTelemetry Metric source.
2. Select **Add Node > Add Processor > Script Execution.**
3. Copy and paste this script into the **Script** field in the processor configuration panel, then click **Save**.
```javascript theme={null}
function processEvent(message, metadata, timestamp, annotations) {
const state = getPipelineStateVariable("operational_state")
message.op_state = state
message.name = message.name.toString()
message.tags.op_state = state
metadata.resource.attributes["pipeline.path"] = "with_mezmo"
if( message == null ){ return null }
return message
}
```
## Route Based on State
You can now set the Pipeline to route data based `on operational_state` with the [Route Processor](/telemetry-pipelines/route-processor).
1. **In the Pipeline Map, click Add Processor.**
2. Select **Route Processor,** and for **Title**, enter `State Router`.
3. You will create three routes, one for the `Normal` state, one for the `Incident` state, and one for the `Deploy` state. After you configure the options for the `Normal` state, click **Add route** to configure the `Incident` and `Deploy` routes.
| Configuration Options | Setting |
| --------------------------------- | ---------------------------------------- |
| **Route 1 Title** | `Normal` |
| **Route 1 Conditional Statement** | `message.op_state` `contains` `normal` |
| **Route 2 Title** | `Incident` |
| **Route 2 Conditional Statement** | `message.op_state` `contains` `incident` |
| **Route 3 Title** | `Deploy` |
| **Route 3 Conditional Statement** | `message.op_state` `contains` `deploy` |
## 5 - Sample Traces in Normal State
For the `unmatched` and `normal` data that pass through the Router, you only need to sample a small proportion of them while the pipeline is in the `normal` operational state. For this example, you will add a Sample processor that will sample every 1 in 10 of the unmatched logs.
1. In the Pipeline Map, click **Add Processor,** then select **Sample**.
2. Enter these configuration options for the processor, then click **Save**.
| Configuration Options | Setting |
| --------------------- | ------- |
| **Rate** | 10 |
6 - Add the Blackhole Destination
You can send your optimized data to any of Mezmo's [Supported Telemetry Data Destinations](/telemetry-pipelines/supported-telemetry-data-destinations), but in this case, the route will terminate in a [Blackhole](/telemetry-pipelines/blackhole-destination) destination that drops all data sent to it. This is useful for testing the data processing of your Pipeline before sending it to production destination.
1. In the Pipeline Map, click **Add Destination**.
2. Select **Blackhole**, and connect it to the to outgoing routes of the Route Processor as shown in the pipeline architecture schematic.
## Deploy the Pipeline
To activate the Pipeline, click **Deploy**.
## Initiate State and Grab State ID
As you did with the Log Handler Pipeline, you need to initialize the state of the Pipeline and get the `State ID` of the pipeline for reference in Step 8.
1. In the Pipeline Map, click on the **State** setting in the upper-left corner, and change it to `Incident`.
2. Change the **State** setting back to `Normal`. This will initialize the Normal state, and generate the`Pipeline_ID` for the pipeline `state-variable`.
3. In a terminal, run this command with the trace `pipeline's ID` and grab that `State ID`.
```bash theme={null}
curl --request GET \
--url 'https://api.mezmo.com/v3/pipeline/state-variable?pipeline_id=PIPELINE_ID' \
--header 'Authorization: Token PIPELINE_API_KEY'
```
## 1 - Create the Pipeline and Add the Source
1. In the Mezmo Web app, click **New Pipeline** and name it `Trace Handler`.
2. In the Pipeline Map, click **Add Source**, then select the OpenTelemetry Trace source you created in Step 2.
## 2 - Add State Variables
A responsive pipeline changes its functioning based on detection of state changes. For this example, you will use the [Script Execution Processor](/telemetry-pipelines/js-script-processor) to add variables to the data that indicate the operational state of the pipeline.
1. Click the `...`menu in the upper-right corner of the OpenTelemetry Metric source.
2. Select **Add Node > Add Processor > Script Execution.**
3. Copy and paste this script into the **Script** field in the processor configuration panel, then click **Save**.
```javascript theme={null}
function processEvent(message, metadata, timestamp, annotations) {
const state = getPipelineStateVariable("operational_state")
message.op_state = state
message.name = message.name.toString()
message.tags.op_state = state
metadata.resource.attributes["pipeline.path"] = "with_mezmo"
if( message == null ){ return null }
return message
}
```
## Route Based on State
You can now set the Pipeline to route data based `on operational_state` with the [Route Processor](/telemetry-pipelines/route-processor).
1. **In the Pipeline Map, click Add Processor.**
2. Select **Route Processor,** and for **Title**, enter `State Router`.
3. You will create three routes, one for the `Normal` state, one for the `Incident` state, and one for the `Deploy` state. After you configure the options for the `Normal` state, click **Add route** to configure the `Incident` and `Deploy` routes.
| Configuration Options | Setting |
| --------------------------------- | ---------------------------------------- |
| **Route 1 Title** | `Normal` |
| **Route 1 Conditional Statement** | `message.op_state` `contains` `normal` |
| **Route 2 Title** | `Incident` |
| **Route 2 Conditional Statement** | `message.op_state` `contains` `incident` |
| **Route 3 Title** | `Deploy` |
| **Route 3 Conditional Statement** | `message.op_state` `contains` `deploy` |
## 5 - Sample Traces in Normal State
For the `unmatched` and `normal` data that pass through the Router, you only need to sample a small proportion of them while the pipeline is in the `normal` operational state. For this example, you will add a Sample processor that will sample every 1 in 10 of the unmatched logs.
1. In the Pipeline Map, click **Add Processor,** then select **Sample**.
2. Enter these configuration options for the processor, then click **Save**.
| Configuration Options | Setting |
| --------------------- | ------- |
| **Rate** | 10 |
6 - Add the Blackhole Destination
You can send your optimized data to any of Mezmo's [Supported Telemetry Data Destinations](/telemetry-pipelines/supported-telemetry-data-destinations), but in this case, the route will terminate in a [Blackhole](/telemetry-pipelines/blackhole-destination) destination that drops all data sent to it. This is useful for testing the data processing of your Pipeline before sending it to production destination.
1. In the Pipeline Map, click **Add Destination**.
2. Select **Blackhole**, and connect it to the to outgoing routes of the Route Processor as shown in the pipeline architecture schematic.
## Deploy the Pipeline
To activate the Pipeline, click **Deploy**.
## Initiate State and Grab State ID
As you did with the Log Handler Pipeline, you need to initialize the state of the Pipeline and get the `State ID` of the pipeline for reference in Step 8.
1. In the Pipeline Map, click on the **State** setting in the upper-left corner, and change it to `Incident`.
2. Change the **State** setting back to `Normal`. This will initialize the Normal state, and generate the`Pipeline_ID` for the pipeline `state-variable`.
3. In a terminal, run this command with the trace `pipeline's ID` and grab that `State ID`.
```bash theme={null}
curl --request GET \
--url 'https://api.mezmo.com/v3/pipeline/state-variable?pipeline_id=PIPELINE_ID' \
--header 'Authorization: Token PIPELINE_API_KEY'
```