> ## Documentation Index
> Fetch the complete documentation index at: https://docs.mezmo.com/llms.txt
> Use this file to discover all available pages before exploring further.
# 5 - Create an OTel Log Handler Pipeline
> Build a responsive log pipeline that parses custom Apache logs, reduces flood events, and routes data by operational state to Log Analysis.
If you run into any issues or have feedback on either the workshop or Pipeline, please reach out to us at [support@mezmo.com](mailto:support@mezmo.com).
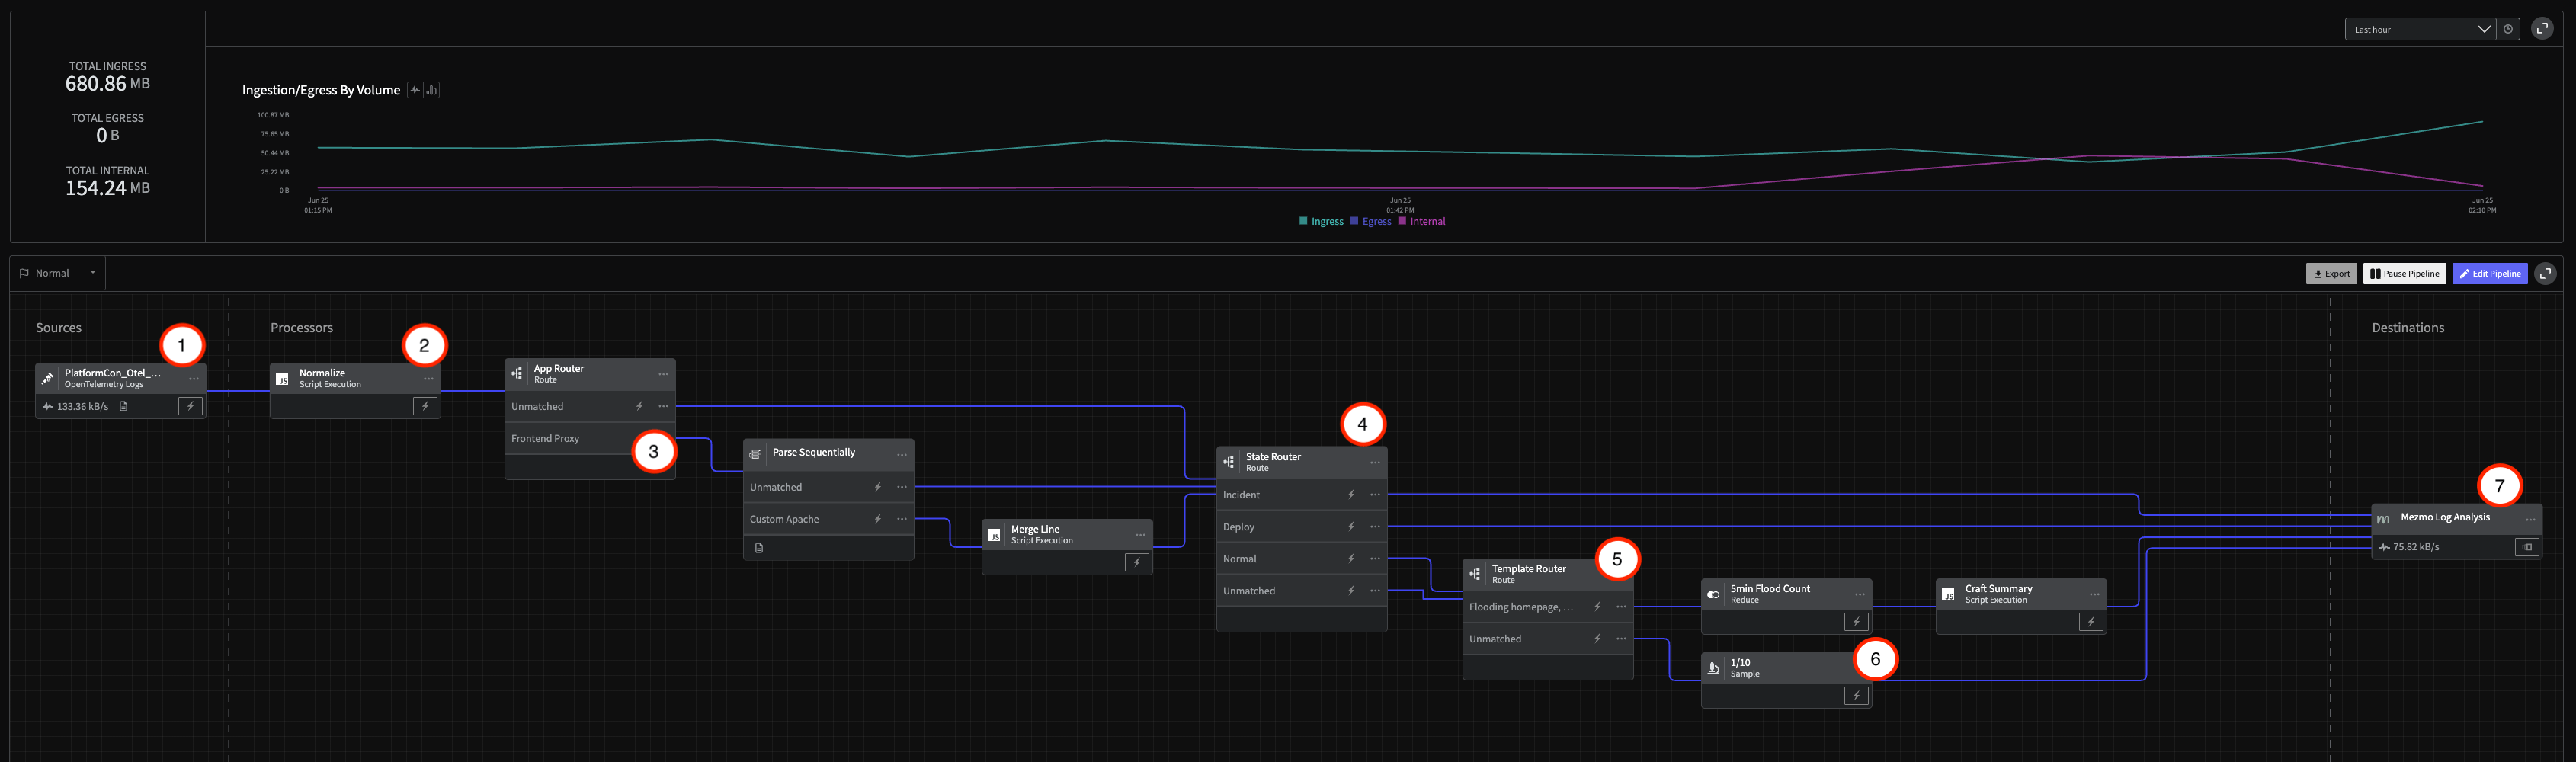
In this step you will create a responsive pipeline to handle the OpenTelemetry log data that includes processing functionality to optimize the custom Apache logs identified in the Data Profile. The Pipeline will send the processed data to the [Mezmo Log Analysis](/telemetry-pipelines/mezmo-destination) destination.
## Pipeline Architecture
 ## 1 - Create the Pipeline and Add the Source
1. In the Mezmo Web app, click **New Pipeline** and name it `Log Handler`.
2. In the Pipeline Map, click **Add Source**, then select the OpenTelemetry Log source you created in Step 2.
## 2 - Add State Variables
A responsive pipeline changes its functioning based on detection of state changes. For this example, you will use the [Script Execution Processor](/telemetry-pipelines/js-script-processor) to add variables to the data that indicate the operational state of the pipeline.
1. Click the `...`menu in the upper-right corner of the OpenTelemetry Log source.
2. Select **Add Node > Add Processor > Script Execution.**
3. **Connect the processor to the OTel Log source.**
4. Copy and paste this script into the **Script** field in the processor configuration panel, then click **Save**.
In addition to adding state variables to the data, this script also normalizes the data so it is more compatible with Mezmo Log Analysis.
```javascript theme={null}
function processEvent(message, metadata, timestamp, annotations) {
metadata.resource.attributes["pipeline.path"] = "with_mezmo"
const state = getPipelineStateVariable("operational_state")
let line = message
let app = metadata.resource.attributes["container.name"]
let host = metadata.resource.attributes["container.hostname"]
let level = metadata.level
if( app == null || app == '' ){
app = metadata.resource["service.name"]
}
if( app == null || app == '' ){
app = metadata.resource["service_name"]
}
if( app == null || app == '' ){
app = metadata.scope.name
}
if( app == null || app == '' ){
app = 'na'
}
if( host == null || host == '' ){
host = metadata.headers["x-kafka-partition-key"]
}
if( host == null || host == '' ){
host = metadata.attributes["log.file.path"]
}
if( host == null || host == '' ){
host = 'na'
}
if( level == null || level == '' ){
level = annotations.level
}
metadata.headers = null
let new_msg = {
"line":line,
"app":app,
"host":host,
"level": level,
"op_state":state,
"meta":metadata,
'_cnt': 1
}
if( message == null ){ return null }
return new_msg
}
```
## 3 - Create the Custom Apache App Logs Parsing Processor Chain
As you saw in the Data Profile from step 4, the OTel data being sent by`frontend-proxy` is an unparsed, custom [format defined by the OpenTelemetry demo](https://github.com/mezmo/opentelemetry-demo/blob/main/src/frontend-proxy/envoy.tmpl.yaml#L80). This data needs to be send through a specialized processor chain that contains a [Route Processor](/telemetry-pipelines/route-processor), a [Parse Sequentially Processor](/telemetry-pipelines/parse-sequentially-processor) that includes a Grok parser, and a [Script Execution Processor](/telemetry-pipelines/js-script-processor) to structure it and make it more easily searchable.
### Route Custom Apache App Data
1. In the Pipeline Map, click **Add Processor**, and select **Route.**
2. Connect the Route processor to the Script Execution processor.
3. Enter these configuration options for the processor, then click **Save**.
| Configuration Options | Setting |
| ------------------------- | ----------------------------------------- |
| **Title** | `App Router` |
| **Route** | `Frontend Proxy` |
| **Conditional Statement** | `if (message.app equal 'frontend-proxy')` |
### Parse the App Data
1. In the Pipeline Map, click **Add Processor,** and select **Parse Sequentially**.
2. Enter these configuration options for the processor, then click **Save**.
3. Connect the Parse Sequentially processor to the `Frontend Proxy` output of the Route processor.
| Configuration Option | Setting |
| --------------------- | --------------------------------------------------------------------------------------------------------------------------------------------------------------------------------------------------------------------------------------------------------------------------------------------------------------------------------------------------------------------------------------------------------------------------------------------------------------------------------------------------------------------------------------------------------------------------------------------------------------------------------------------------------------------------------------------------------------------------------------------------------------------------------------------------------------------------------------------------- |
| Field | `message.line` |
| Target Field | `message.line_parsed` |
| Custom Parser Title | `Custom Apache` |
| Customer Parser | `Grok Pattern` |
| Custom Parser Pattern | `%{SQUARE_BRACKET`}%\{TIMESTAMP\_ISO8601:dt`}%{SQUARE_BRACKET} %{DOUBLE_QUOTE}%{DATA:method} %{DATA:path} %{DATA:http_protocol}%{DOUBLE_QUOTE} %{DATA:rsp_code} %{DATA:rsp_flags} %{DATA:rsp_code_details} %{DATA:conn_term_details} %{DOUBLE_QUOTE}%{DATA:upstream_transport_failure_reason}%{DOUBLE_QUOTE} %{DATA:bytes_received} %{DATA:bytes_sent} %{DATA:duration} %{DATA:rsp_upstream_service_time} %{DOUBLE_QUOTE}%{DATA:req_forward_for}%{DOUBLE_QUOTE} %{DOUBLE_QUOTE}%{DATA:req_user_agent}%{DOUBLE_QUOTE} %{DOUBLE_QUOTE}%{DATA:req_id}%{DOUBLE_QUOTE} %{DOUBLE_QUOTE}%{DATA:req_authority}%{DOUBLE_QUOTE} %{DOUBLE_QUOTE}%{DATA:upstream_host}%{DOUBLE_QUOTE} %{DATA:upstream_cluster} %{DATA:upstream_local_addr} %{DATA:downstream_local_addr} %{DATA:downstream_remote_addr} %{DATA:requested_server_name} %{GREEDYDATA:route_name}` |
### Merge Custom App Data Lines
In this case, the Script Execution processor is used to preserve the original line for the custom app data.
1. In the Pipeline Map, click **Add Processor** and select **Script Execution**.
2. Copy and paste this script into the **Script** field.
3. Click **Save**, then connect the Script Execution processor the to the `Custom Apache` output of the Parse Sequentially processor.
```javascript theme={null}
function processEvent(message, metadata, timestamp, annotations) {
let old_line = message.line
message.line = message.line_parsed
message.line.message = old_line
message.line_parsed = null
return message
}
```
## 4 - Route Data Based on State
The next Route processor in the chain will route data based on the operational state. For the Incident and Deploy states, the data is sent directly to Mezmo Log Analysis, while Normal or unmatched data is sent through a final processing chain to aggregate and reduce the volume of the custom app log events.
1. In the Pipeline map, click **Add Processor,** and select **Route**.
2. Enter these configuration options for the processor, then click **Save**.
| Configuration Option | Setting |
| ----------------------------- | --------------------------------------------- |
| Route 1 Title | `Normal` |
| Route 1 Conditional Statement | `if (message.op_state` `contains` `normal)` |
| Route 2 Title | `Incident` |
| Route 2 Conditional Statement | `if (message.op_state` `contains` `incident)` |
| Route 3 Title | `Deploy` |
| Route 3 Conditional Statement | `if (message.op_state` `contains` `deploy)` |
## 5 - Create the "Flooding Homepage" Reduction Processing Chain
During `normal` conditions, the log data contains a high volume of "homepage flooding" logs that convey little information in their unprocessed state. One technique to deal with noisy data like this is to [convert events to metrics. ](/practioner-guide-data-optimization/pipeline-example--convert-200-events-to-metrics) In this case, the data is routed to a [Reduce Processor](/telemetry-pipelines/reduce-processor), which will provide a count of the events over five minutes to Mezmo Log Analysis, and then sent to a Script Execution process to generate a summary message.
### Route the Data
1. In the Pipeline Map, click **Add Processor,** then select **Route**.
2. Enter these configuration options for the processor, then click **Save**.
3. Connect the `Normal` and `Unmatched` routes of the State Router to the input of this Route processor.
| Configuration Options | Setting |
| --------------------------------- | ------------------------------------------------------------------------------------------------ |
| **Route 1 Title** | `Flooding homepage` |
| **Route 1 Conditional Statement** | `if (message.app equal load-generator) AND (message.line contains Flooding homepage, iteration)` |
### Reduce the Data
* In the Pipeline Map, click **Add Processor,** then select **Reduce**.
* Enter these configuration options for the processor, then click **Save**.
| Configuration Option | Setting |
| ------------------------ | ------------------- |
| Title | `5min Flood count` |
| Duration | `5 minutes` |
| Group by Field Path | `message.host` |
| Merge Strategy per Field | |
| Field Path | `message.cnt sum` |
### Add a Summary Message
Finally, we will convert the output into a summary message using the following configuration
```javascript theme={null}
function processEvent(message, metadata, timestamp, annotations) {
message.line = {
'message':'Flooded homepage ' + message._cnt.toString() + ' times',
'count': message._cnt
}
return message
}
```
## 6 - Sample Normal State Logs
For the `unmatched` logs that pass through the Router, you only need to sample a small proportion of them while the pipeline is in the `normal` operational state. For this example, you will add a Sample processor that will sample every 1 in 10 of the unmatched logs.
1. In the Pipeline Map, click **Add Processor,** then select **Sample**.
2. Enter these configuration options for the processor, then click **Save**.
| Configuration Options | Setting |
| --------------------- | ------- |
| **Rate** | `1/10` |
## 7 - Connect to Mezmo Log Analysis
Finally, we will send all of this data into Mezmo Log Analysis. Because of our earlier work normalizing data in Step 3, we can simply add a final Destination to all nodes (including the `Incident` and `Deploy` paths).
1. In the Pipeline Map, click Add Destination.
2. Select Mezmo Log Analysis, enter these settings, then click **Save**.
3. After saving the configuration, connect the Log Analysis destination to the outputs of the other processors as shown in the architecture schematic.
| Configuration Options | Setting |
| ---------------------------- | -------------------------------------------- |
| **Ingestion Key** | Generate a new one or select an existing one |
| **Host Name** | `{{message.host}}` |
| **Tags** | `otel-demo` |
| **Log Construction Scheme** | `message pass-through` |
## 7 - Deploy the Pipeline
To activate the pipeline, click **Deploy** in the upper-right corner of the pipeline map.
## 8 - Initiate State and Grab State ID
Our final step is to initiate and grab the state ID for the pipeline in Normal operation.
Click the **State** menu in the upper-left corner of the active pipeline, change the state to `Incident`, then change it back to `Normal.`
Now that has been initiated, you will need get the `Log Handler` pipeline's ID (found in the URL at `app.mezmo.com/ACCOUNT_ID/pipelines/PIPELINE_ID`) along with a Pipeline API Key here. Then, modify the following script with both that `PIPELINE_ID` and Pipeline API Key
```bash theme={null}
curl --request GET \
--url 'https://api.mezmo.com/v3/pipeline/state-variable?pipeline_id=PIPELINE_ID' \
--header 'Authorization: Token PIPELINE_API_KEY'
```
Take the response and save the `STATE_ID` for later. You will find it in the `operational_state`'s data packet, which should look something like this:
```bash theme={null}
{
"meta": {
"pk": "id",
"type": "pipeline-state-variable",
"links": {
"self": {
"create": {
"uri": "/v3/pipeline/{pipeline_id}/state-variable",
"method": "post"
},
"list": {
"uri": "/v3/pipeline/{pipeline_id}/state-variable",
"method": "get"
},
"replace": {
"uri": "/v3/pipeline/{pipeline_id}/state-variable/{id}",
"method": "put"
},
"update": {
"uri": "/v3/pipeline/{pipeline_id}/state-variable",
"method": "patch"
},
"detail": null
},
"related": {
"pipeline": {
"list": "/v3/pipeline",
"detail": "/v3/pipeline/{pipeline_id}"
}
}
},
"page": {
"next": null,
"previous": null
}
},
"data": [
{
"id": "STATE_ID",
"account_id": "ACCOUNT_ID",
"pipeline_id": "PIPELINE_ID",
"state": {
"operational_state": "normal"
},
"created_at": "UTC Timestamp",
"updated_at": "UTC Timestamp"
}
]
}
```
## 9 - View In Mezmo Log Analysis
Navigate to Log Analysis and view the incoming data. In particular, if you used the `tag` above you can simply search for `tag:otel-demo`.
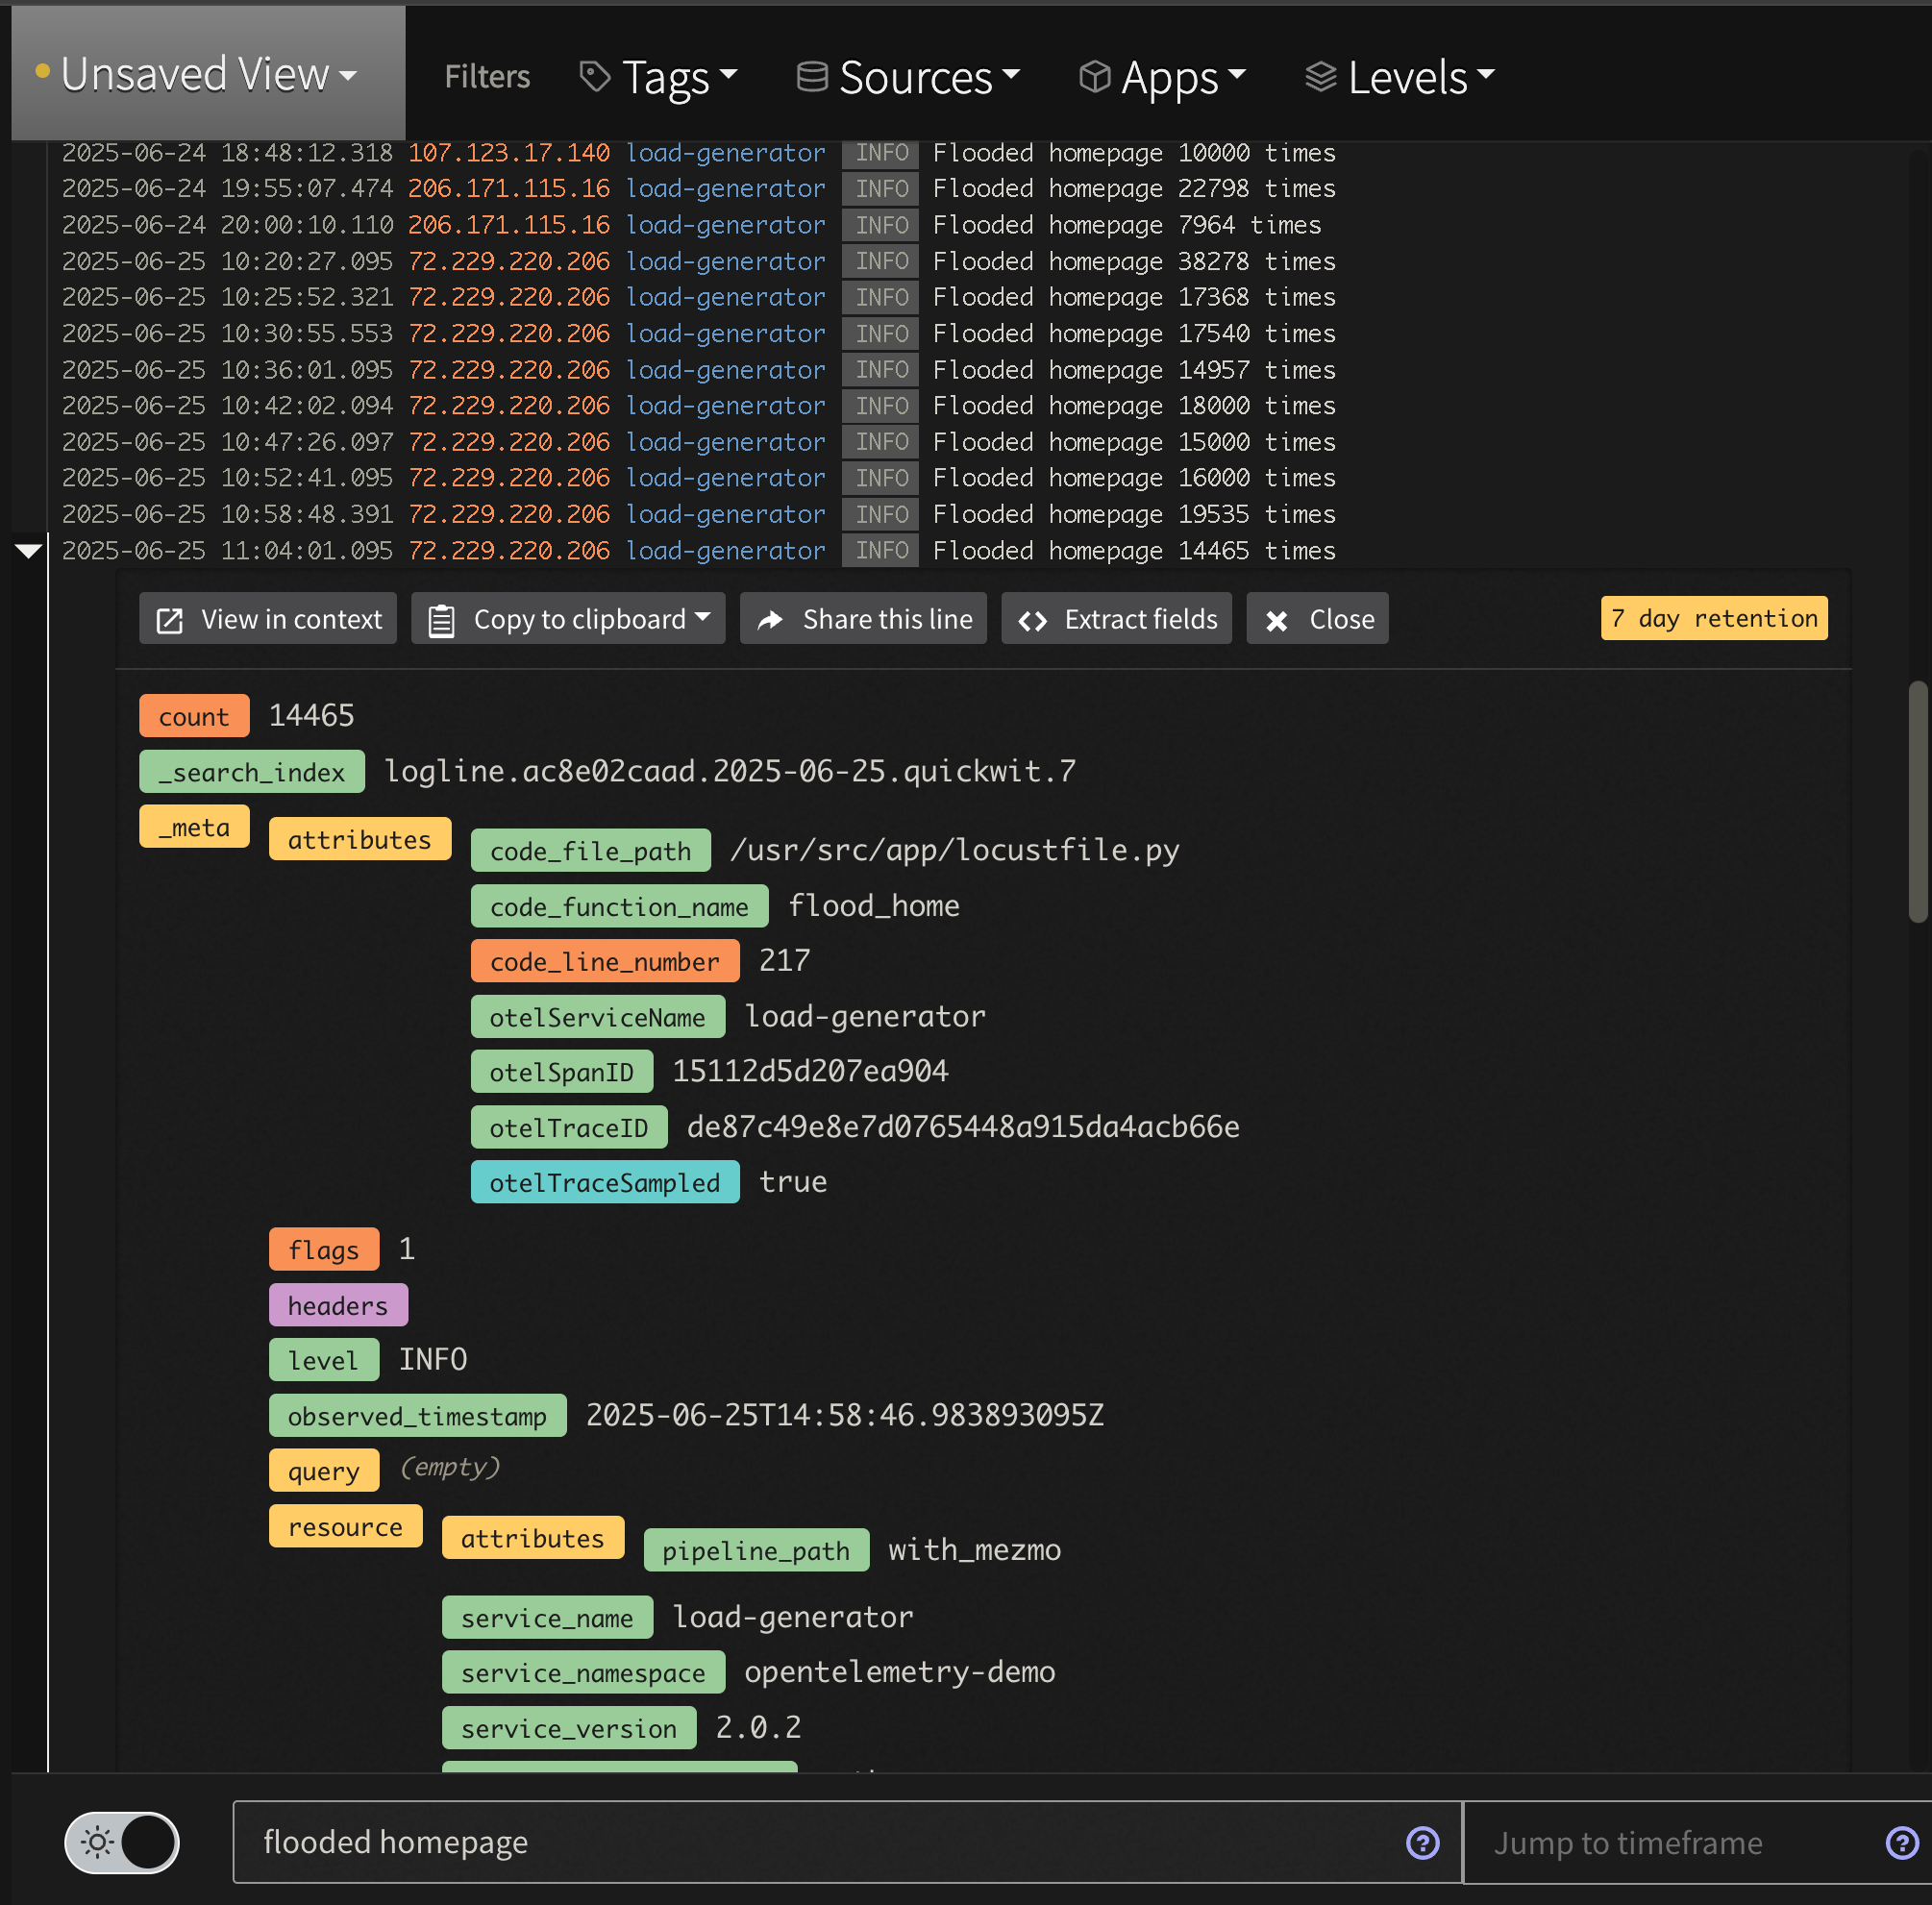
First, look for the aggregated data by searching for `tag:otel-demo "flooded homepage"`. Notice that instead of raw lines like we saw in the Profile, we now have an aggregated message to watch saving tens of thousands of log lines.
## 1 - Create the Pipeline and Add the Source
1. In the Mezmo Web app, click **New Pipeline** and name it `Log Handler`.
2. In the Pipeline Map, click **Add Source**, then select the OpenTelemetry Log source you created in Step 2.
## 2 - Add State Variables
A responsive pipeline changes its functioning based on detection of state changes. For this example, you will use the [Script Execution Processor](/telemetry-pipelines/js-script-processor) to add variables to the data that indicate the operational state of the pipeline.
1. Click the `...`menu in the upper-right corner of the OpenTelemetry Log source.
2. Select **Add Node > Add Processor > Script Execution.**
3. **Connect the processor to the OTel Log source.**
4. Copy and paste this script into the **Script** field in the processor configuration panel, then click **Save**.
In addition to adding state variables to the data, this script also normalizes the data so it is more compatible with Mezmo Log Analysis.
```javascript theme={null}
function processEvent(message, metadata, timestamp, annotations) {
metadata.resource.attributes["pipeline.path"] = "with_mezmo"
const state = getPipelineStateVariable("operational_state")
let line = message
let app = metadata.resource.attributes["container.name"]
let host = metadata.resource.attributes["container.hostname"]
let level = metadata.level
if( app == null || app == '' ){
app = metadata.resource["service.name"]
}
if( app == null || app == '' ){
app = metadata.resource["service_name"]
}
if( app == null || app == '' ){
app = metadata.scope.name
}
if( app == null || app == '' ){
app = 'na'
}
if( host == null || host == '' ){
host = metadata.headers["x-kafka-partition-key"]
}
if( host == null || host == '' ){
host = metadata.attributes["log.file.path"]
}
if( host == null || host == '' ){
host = 'na'
}
if( level == null || level == '' ){
level = annotations.level
}
metadata.headers = null
let new_msg = {
"line":line,
"app":app,
"host":host,
"level": level,
"op_state":state,
"meta":metadata,
'_cnt': 1
}
if( message == null ){ return null }
return new_msg
}
```
## 3 - Create the Custom Apache App Logs Parsing Processor Chain
As you saw in the Data Profile from step 4, the OTel data being sent by`frontend-proxy` is an unparsed, custom [format defined by the OpenTelemetry demo](https://github.com/mezmo/opentelemetry-demo/blob/main/src/frontend-proxy/envoy.tmpl.yaml#L80). This data needs to be send through a specialized processor chain that contains a [Route Processor](/telemetry-pipelines/route-processor), a [Parse Sequentially Processor](/telemetry-pipelines/parse-sequentially-processor) that includes a Grok parser, and a [Script Execution Processor](/telemetry-pipelines/js-script-processor) to structure it and make it more easily searchable.
### Route Custom Apache App Data
1. In the Pipeline Map, click **Add Processor**, and select **Route.**
2. Connect the Route processor to the Script Execution processor.
3. Enter these configuration options for the processor, then click **Save**.
| Configuration Options | Setting |
| ------------------------- | ----------------------------------------- |
| **Title** | `App Router` |
| **Route** | `Frontend Proxy` |
| **Conditional Statement** | `if (message.app equal 'frontend-proxy')` |
### Parse the App Data
1. In the Pipeline Map, click **Add Processor,** and select **Parse Sequentially**.
2. Enter these configuration options for the processor, then click **Save**.
3. Connect the Parse Sequentially processor to the `Frontend Proxy` output of the Route processor.
| Configuration Option | Setting |
| --------------------- | --------------------------------------------------------------------------------------------------------------------------------------------------------------------------------------------------------------------------------------------------------------------------------------------------------------------------------------------------------------------------------------------------------------------------------------------------------------------------------------------------------------------------------------------------------------------------------------------------------------------------------------------------------------------------------------------------------------------------------------------------------------------------------------------------------------------------------------------------- |
| Field | `message.line` |
| Target Field | `message.line_parsed` |
| Custom Parser Title | `Custom Apache` |
| Customer Parser | `Grok Pattern` |
| Custom Parser Pattern | `%{SQUARE_BRACKET`}%\{TIMESTAMP\_ISO8601:dt`}%{SQUARE_BRACKET} %{DOUBLE_QUOTE}%{DATA:method} %{DATA:path} %{DATA:http_protocol}%{DOUBLE_QUOTE} %{DATA:rsp_code} %{DATA:rsp_flags} %{DATA:rsp_code_details} %{DATA:conn_term_details} %{DOUBLE_QUOTE}%{DATA:upstream_transport_failure_reason}%{DOUBLE_QUOTE} %{DATA:bytes_received} %{DATA:bytes_sent} %{DATA:duration} %{DATA:rsp_upstream_service_time} %{DOUBLE_QUOTE}%{DATA:req_forward_for}%{DOUBLE_QUOTE} %{DOUBLE_QUOTE}%{DATA:req_user_agent}%{DOUBLE_QUOTE} %{DOUBLE_QUOTE}%{DATA:req_id}%{DOUBLE_QUOTE} %{DOUBLE_QUOTE}%{DATA:req_authority}%{DOUBLE_QUOTE} %{DOUBLE_QUOTE}%{DATA:upstream_host}%{DOUBLE_QUOTE} %{DATA:upstream_cluster} %{DATA:upstream_local_addr} %{DATA:downstream_local_addr} %{DATA:downstream_remote_addr} %{DATA:requested_server_name} %{GREEDYDATA:route_name}` |
### Merge Custom App Data Lines
In this case, the Script Execution processor is used to preserve the original line for the custom app data.
1. In the Pipeline Map, click **Add Processor** and select **Script Execution**.
2. Copy and paste this script into the **Script** field.
3. Click **Save**, then connect the Script Execution processor the to the `Custom Apache` output of the Parse Sequentially processor.
```javascript theme={null}
function processEvent(message, metadata, timestamp, annotations) {
let old_line = message.line
message.line = message.line_parsed
message.line.message = old_line
message.line_parsed = null
return message
}
```
## 4 - Route Data Based on State
The next Route processor in the chain will route data based on the operational state. For the Incident and Deploy states, the data is sent directly to Mezmo Log Analysis, while Normal or unmatched data is sent through a final processing chain to aggregate and reduce the volume of the custom app log events.
1. In the Pipeline map, click **Add Processor,** and select **Route**.
2. Enter these configuration options for the processor, then click **Save**.
| Configuration Option | Setting |
| ----------------------------- | --------------------------------------------- |
| Route 1 Title | `Normal` |
| Route 1 Conditional Statement | `if (message.op_state` `contains` `normal)` |
| Route 2 Title | `Incident` |
| Route 2 Conditional Statement | `if (message.op_state` `contains` `incident)` |
| Route 3 Title | `Deploy` |
| Route 3 Conditional Statement | `if (message.op_state` `contains` `deploy)` |
## 5 - Create the "Flooding Homepage" Reduction Processing Chain
During `normal` conditions, the log data contains a high volume of "homepage flooding" logs that convey little information in their unprocessed state. One technique to deal with noisy data like this is to [convert events to metrics. ](/practioner-guide-data-optimization/pipeline-example--convert-200-events-to-metrics) In this case, the data is routed to a [Reduce Processor](/telemetry-pipelines/reduce-processor), which will provide a count of the events over five minutes to Mezmo Log Analysis, and then sent to a Script Execution process to generate a summary message.
### Route the Data
1. In the Pipeline Map, click **Add Processor,** then select **Route**.
2. Enter these configuration options for the processor, then click **Save**.
3. Connect the `Normal` and `Unmatched` routes of the State Router to the input of this Route processor.
| Configuration Options | Setting |
| --------------------------------- | ------------------------------------------------------------------------------------------------ |
| **Route 1 Title** | `Flooding homepage` |
| **Route 1 Conditional Statement** | `if (message.app equal load-generator) AND (message.line contains Flooding homepage, iteration)` |
### Reduce the Data
* In the Pipeline Map, click **Add Processor,** then select **Reduce**.
* Enter these configuration options for the processor, then click **Save**.
| Configuration Option | Setting |
| ------------------------ | ------------------- |
| Title | `5min Flood count` |
| Duration | `5 minutes` |
| Group by Field Path | `message.host` |
| Merge Strategy per Field | |
| Field Path | `message.cnt sum` |
### Add a Summary Message
Finally, we will convert the output into a summary message using the following configuration
```javascript theme={null}
function processEvent(message, metadata, timestamp, annotations) {
message.line = {
'message':'Flooded homepage ' + message._cnt.toString() + ' times',
'count': message._cnt
}
return message
}
```
## 6 - Sample Normal State Logs
For the `unmatched` logs that pass through the Router, you only need to sample a small proportion of them while the pipeline is in the `normal` operational state. For this example, you will add a Sample processor that will sample every 1 in 10 of the unmatched logs.
1. In the Pipeline Map, click **Add Processor,** then select **Sample**.
2. Enter these configuration options for the processor, then click **Save**.
| Configuration Options | Setting |
| --------------------- | ------- |
| **Rate** | `1/10` |
## 7 - Connect to Mezmo Log Analysis
Finally, we will send all of this data into Mezmo Log Analysis. Because of our earlier work normalizing data in Step 3, we can simply add a final Destination to all nodes (including the `Incident` and `Deploy` paths).
1. In the Pipeline Map, click Add Destination.
2. Select Mezmo Log Analysis, enter these settings, then click **Save**.
3. After saving the configuration, connect the Log Analysis destination to the outputs of the other processors as shown in the architecture schematic.
| Configuration Options | Setting |
| ---------------------------- | -------------------------------------------- |
| **Ingestion Key** | Generate a new one or select an existing one |
| **Host Name** | `{{message.host}}` |
| **Tags** | `otel-demo` |
| **Log Construction Scheme** | `message pass-through` |
## 7 - Deploy the Pipeline
To activate the pipeline, click **Deploy** in the upper-right corner of the pipeline map.
## 8 - Initiate State and Grab State ID
Our final step is to initiate and grab the state ID for the pipeline in Normal operation.
Click the **State** menu in the upper-left corner of the active pipeline, change the state to `Incident`, then change it back to `Normal.`
Now that has been initiated, you will need get the `Log Handler` pipeline's ID (found in the URL at `app.mezmo.com/ACCOUNT_ID/pipelines/PIPELINE_ID`) along with a Pipeline API Key here. Then, modify the following script with both that `PIPELINE_ID` and Pipeline API Key
```bash theme={null}
curl --request GET \
--url 'https://api.mezmo.com/v3/pipeline/state-variable?pipeline_id=PIPELINE_ID' \
--header 'Authorization: Token PIPELINE_API_KEY'
```
Take the response and save the `STATE_ID` for later. You will find it in the `operational_state`'s data packet, which should look something like this:
```bash theme={null}
{
"meta": {
"pk": "id",
"type": "pipeline-state-variable",
"links": {
"self": {
"create": {
"uri": "/v3/pipeline/{pipeline_id}/state-variable",
"method": "post"
},
"list": {
"uri": "/v3/pipeline/{pipeline_id}/state-variable",
"method": "get"
},
"replace": {
"uri": "/v3/pipeline/{pipeline_id}/state-variable/{id}",
"method": "put"
},
"update": {
"uri": "/v3/pipeline/{pipeline_id}/state-variable",
"method": "patch"
},
"detail": null
},
"related": {
"pipeline": {
"list": "/v3/pipeline",
"detail": "/v3/pipeline/{pipeline_id}"
}
}
},
"page": {
"next": null,
"previous": null
}
},
"data": [
{
"id": "STATE_ID",
"account_id": "ACCOUNT_ID",
"pipeline_id": "PIPELINE_ID",
"state": {
"operational_state": "normal"
},
"created_at": "UTC Timestamp",
"updated_at": "UTC Timestamp"
}
]
}
```
## 9 - View In Mezmo Log Analysis
Navigate to Log Analysis and view the incoming data. In particular, if you used the `tag` above you can simply search for `tag:otel-demo`.
First, look for the aggregated data by searching for `tag:otel-demo "flooded homepage"`. Notice that instead of raw lines like we saw in the Profile, we now have an aggregated message to watch saving tens of thousands of log lines.
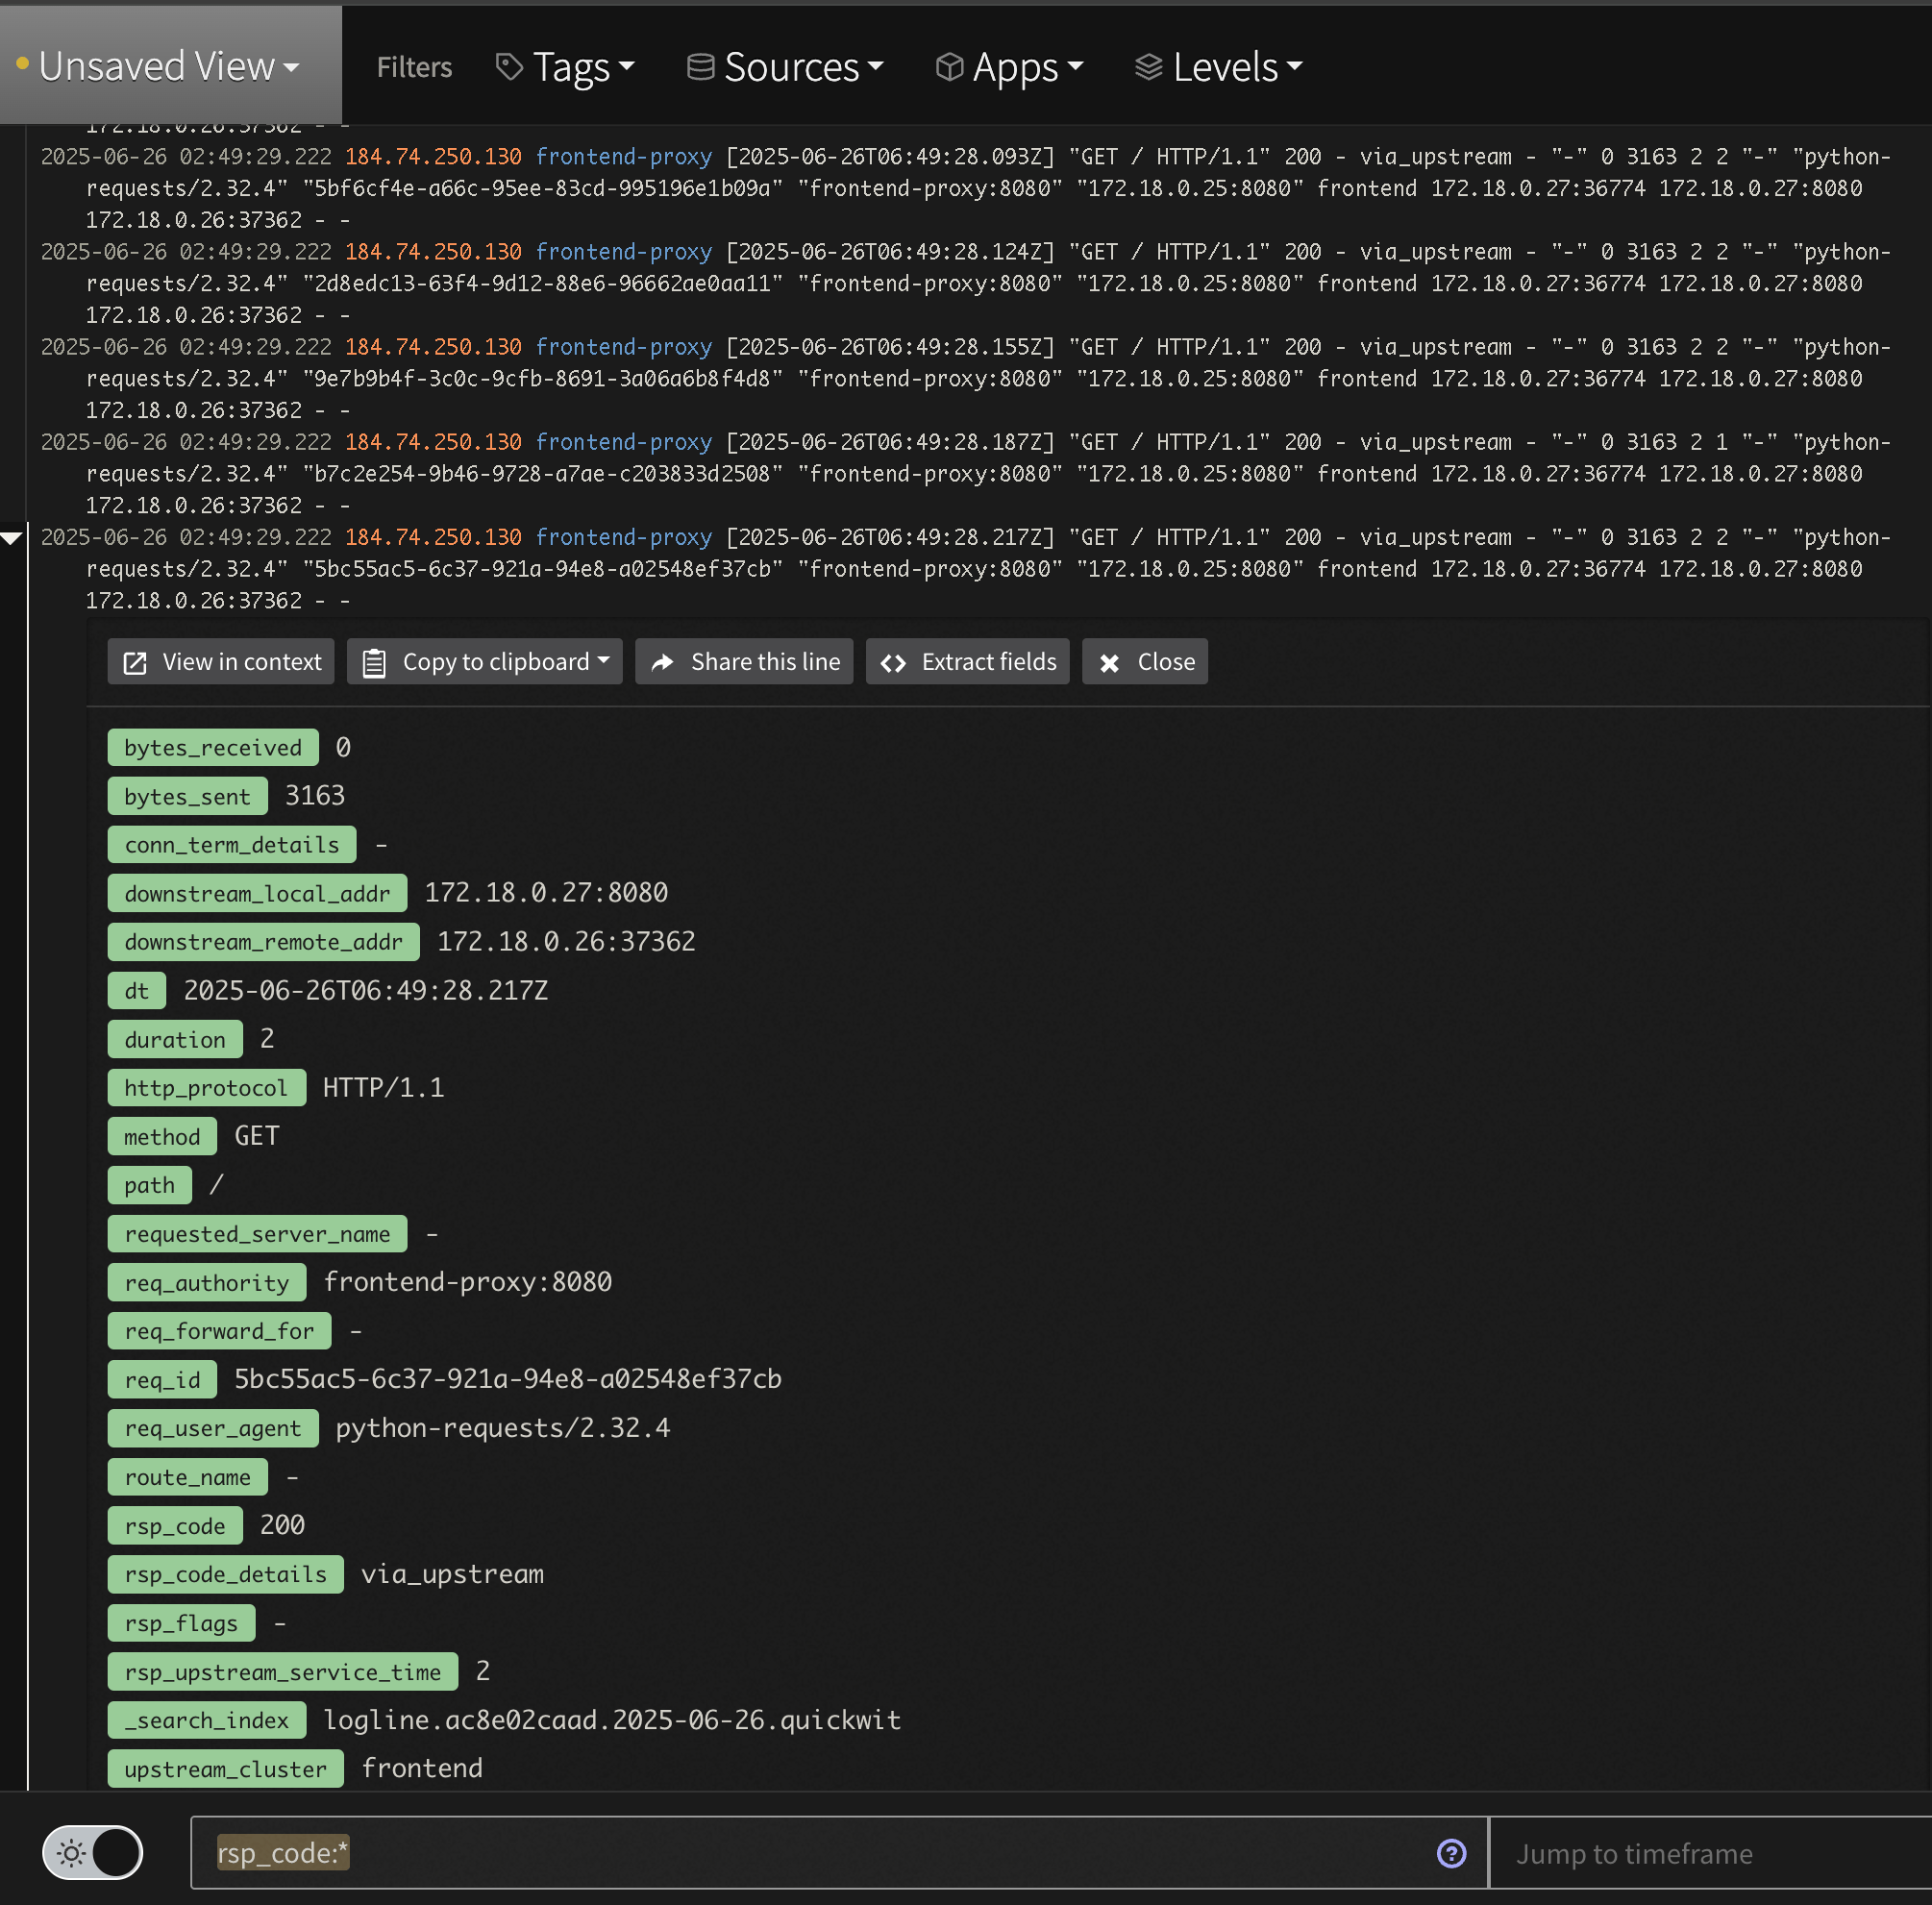
 Second, check out the newly parsed data by searching for `tag:otel-demo app:frontend-proxy`. While logs are displayed nicely in the Log Viewer, you can expand a line and see all the nested structure that is easily searchable. For instance, to see all 2xx responses enter the query `tag:otel-demo app:frontend-proxy resp_code:(>=200 AND <300)`
 If you want to learn more about Log Analysis and creating things like saved Views, Alerts and more check out our [docs here](/docs) or reaching out to [support@mezmo.com](mailto:support@mezmo.com)