> ## Documentation Index
> Fetch the complete documentation index at: https://docs.mezmo.com/llms.txt
> Use this file to discover all available pages before exploring further.
# 4 - Analyze the Source Data
> Build a Log Explorer pipeline with a Script Execution and Data Profiler processor to analyze your OTel source data.
If you run into any issues or have feedback on either the workshop or Pipeline, please reach out to us at [support@mezmo.com](mailto:support@mezmo.com).
Mezmo's [Data Profiler](/telemetry-pipelines/data-profiler-processor) analyzes your source data and provides a [a data profile](/telemetry-pipelines/data-profiling) that helps you understand your source data, and configure the [Pipeline Processors](/telemetry-pipelines/supported-processors) to optimize it for your purposes. In this step, you'll set up a pipeline with the shared OTel sources that will include a [Script Execution Processor](/telemetry-pipelines/js-script-processor) to format the data for analysis, and a [Data Profiler Processor](/telemetry-pipelines/data-profiler-processor) to analyze it.
## Create a Log Explorer Pipeline
1. In the [Mezmo Web App](https://app.mezmo.com), go to **Pipelines** and click **New Pipeline.**
2. Select **Create a blank pipeline**.
3. For **Pipeline Name,** enter `Log Explorer`.
4. Under **Deployment Options**, select **SaaS**.
5. Under **Select a path**, select **Create a blank pipeline**.
6. Click **Continue**.
## Add the OpenTelemtry Log Source
1. In the Pipeline Map, click **Add Source**.
2. Under **Shared Sources**, select the **OTel Log Source**.
3. Click **Save**. The Source will be added to the Pipeline Map.
## Add the OTel Mapping Script
This script will map OTel fields to a format for the Data Profiler to analyze.
1. In the Profile Map, click **Add Processor**.
2. Select **Script Execution**.
3. Copy and paste this script into the **Script** field.
4. Click **Save**.
5. Connect the Source to the Script Execution Processor.
```javascript theme={null}
function processEvent(message, metadata, timestamp, annotations) {
let line = message
let app = metadata.resource.attributes["container.name"]
let host = metadata.resource.attributes["container.hostname"]
let level = metadata.level
if( app == null || app == '' ){
app = metadata.resource["service.name"]
}
if( app == null || app == '' ){
app = metadata.resource["service_name"]
}
if( app == null || app == '' ){
app = metadata.scope.name
}
if( app == null || app == '' ){
app = 'na'
}
if( host == null || host == '' ){
host = metadata.headers["x-kafka-partition-key"]
}
if( host == null || host == '' ){
host = metadata.attributes["log.file.path"]
}
if( host == null || host == '' ){
host = 'na'
}
if( level == null || level == '' ){
level = annotations.level
}
let new_msg = {
"line":line,
"app":app,
"host":host,
"level":level
}
// Extract metadata to top level fields
for( const meta of Object.entries(metadata) ){
let meta_name = 'metadataotel_' + meta[0].toString()
let meta_val = meta[1]
new_msg[meta_name] = meta_val
}
return new_msg
}
```
## Add a Data Profiler Processor
1. In the Pipeline Map, click **Add Processor**.
2. Select **Data Profiler**, and give it the name `OTel Demo Log Exploration`.
3. Click **Save**.
4. Connect the Script Execution Processor to the Data Profiler Processor.
## Deploy the Pipeline and View the Data Profile
In the Pipeline Map, click **Deploy Pipeline** to activate the Pipeline. The Data Profiler will begin to run, and after a few minutes you will see a Data Profile similar to this:
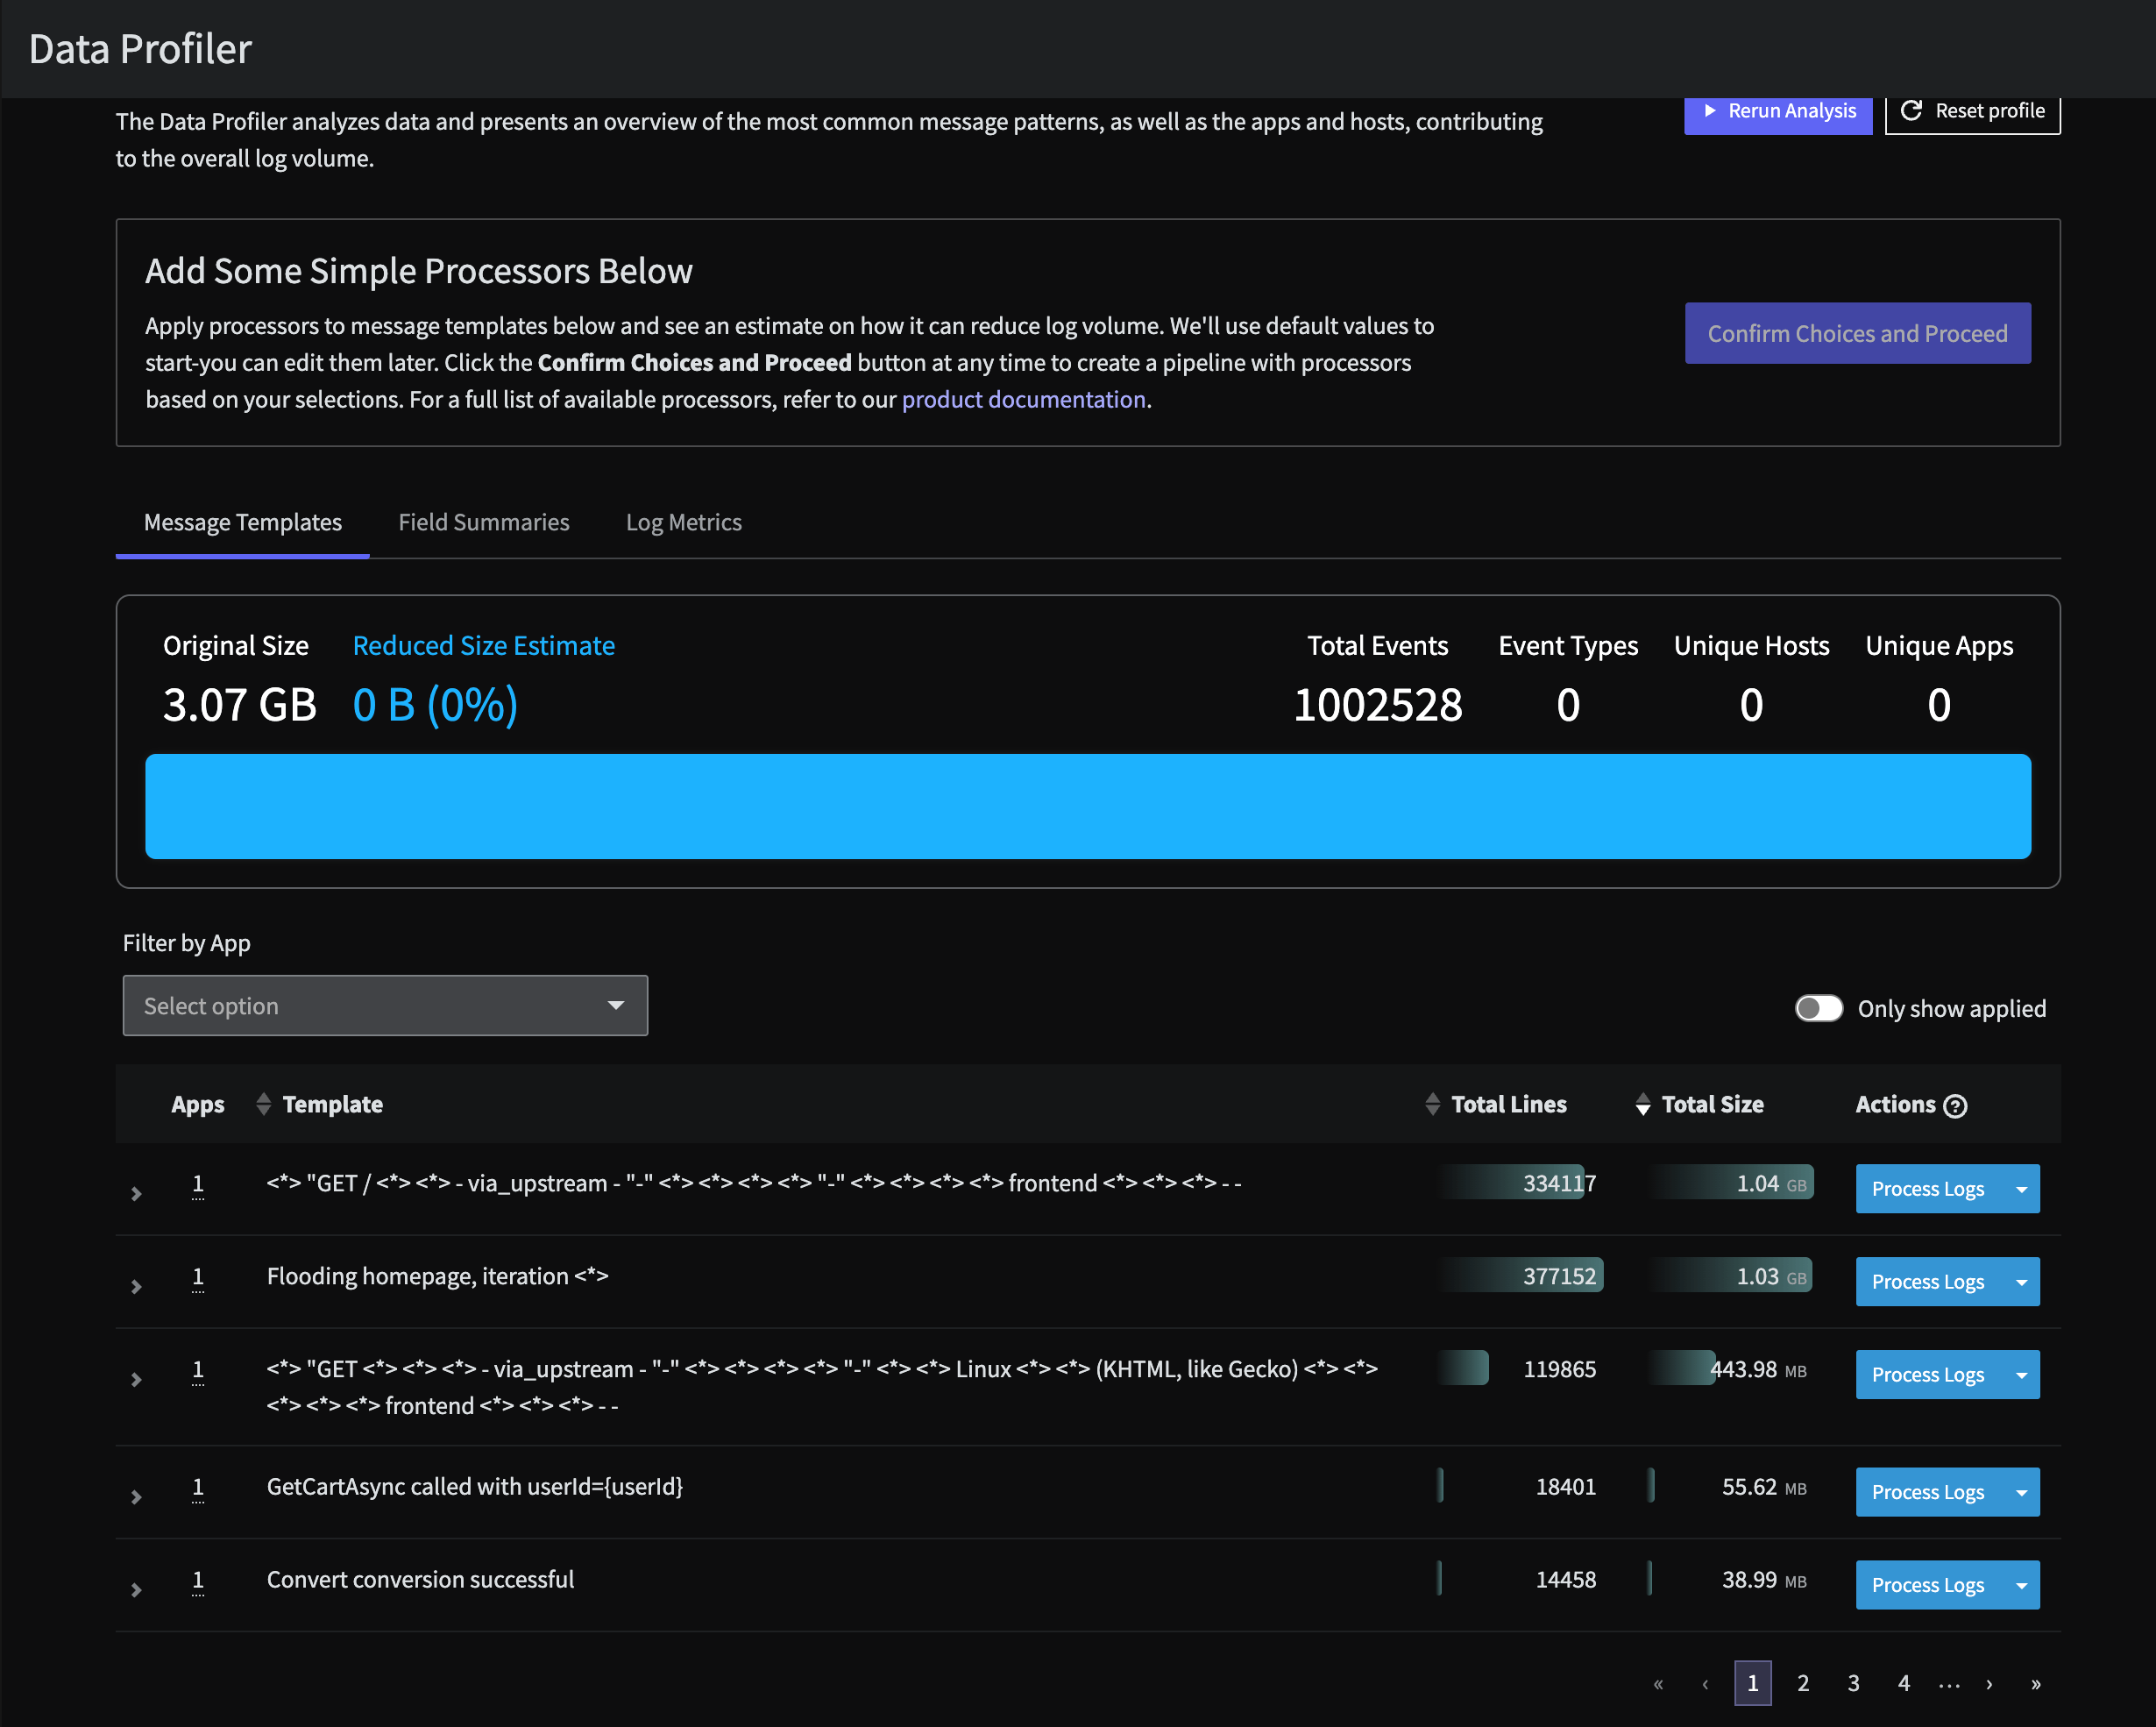 Two things you will immediately notice:
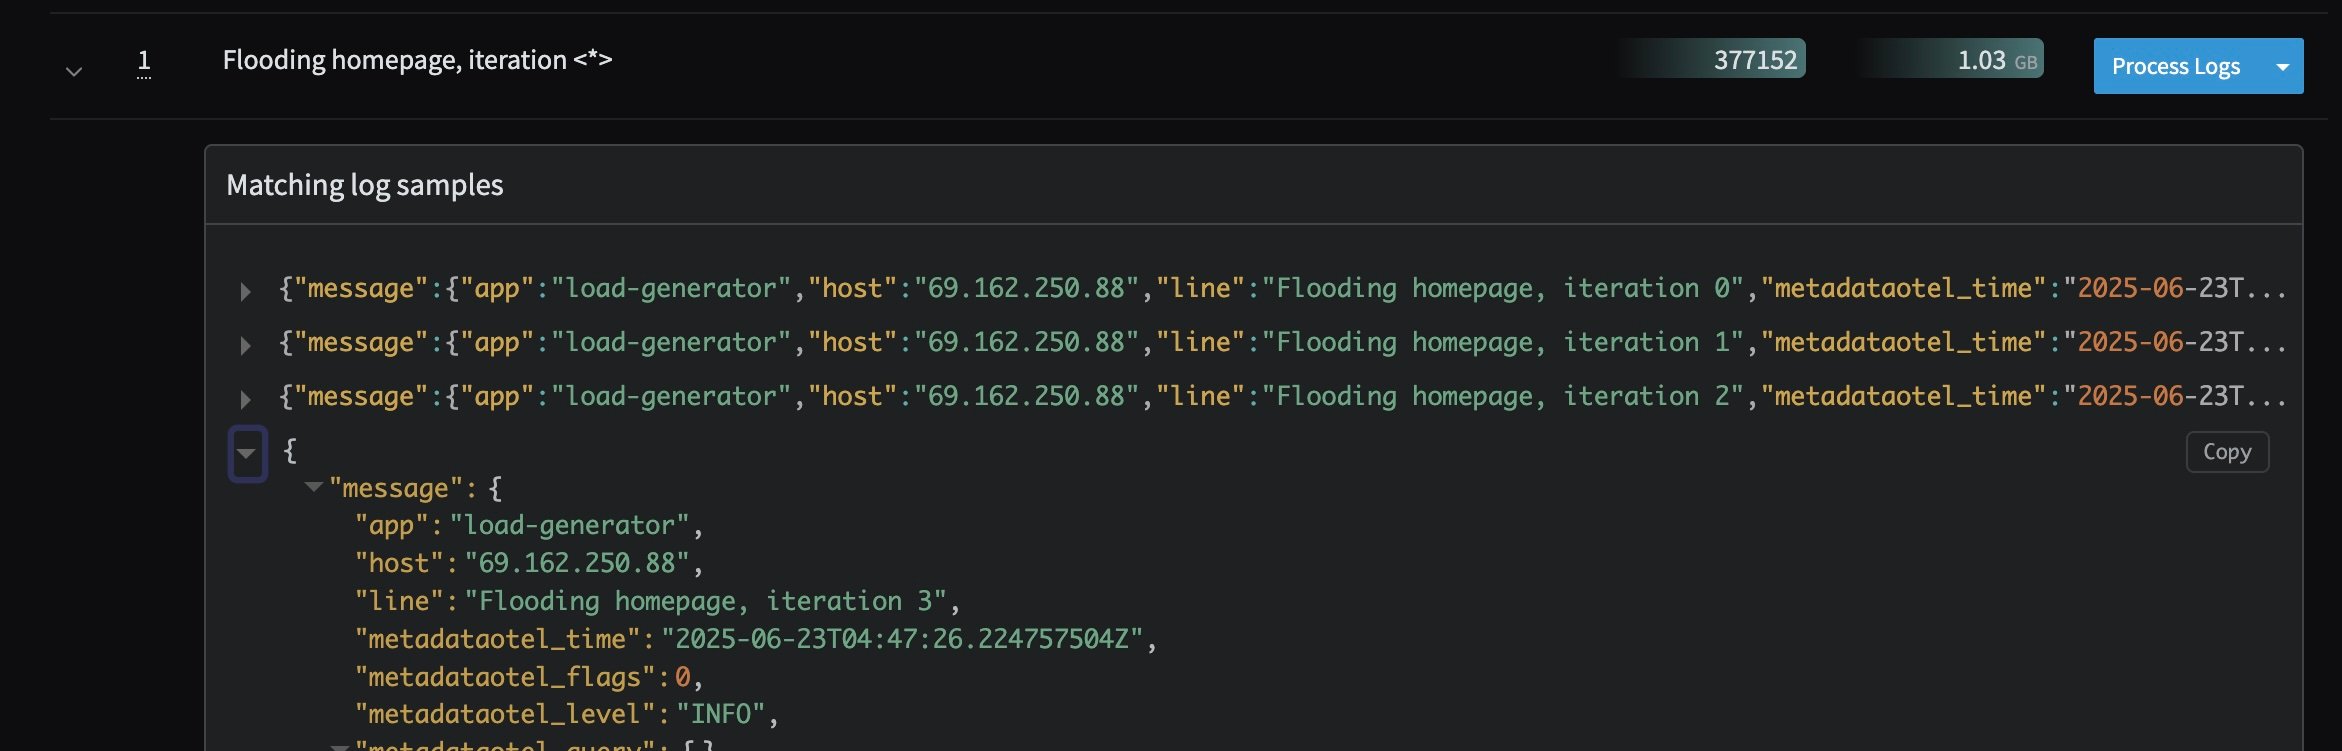
1. The `load-generator` service is sending a huge volume of logs simply stating a homepage is being flooded. This is standard behavior of the OpenTelemetry Demo using the [Feature Flag: loadgeneratorFloodHomepage](https://opentelemetry.io/docs/demo/feature-flags/) , but this data is noisy and costly to retain.
Two things you will immediately notice:
1. The `load-generator` service is sending a huge volume of logs simply stating a homepage is being flooded. This is standard behavior of the OpenTelemetry Demo using the [Feature Flag: loadgeneratorFloodHomepage](https://opentelemetry.io/docs/demo/feature-flags/) , but this data is noisy and costly to retain.
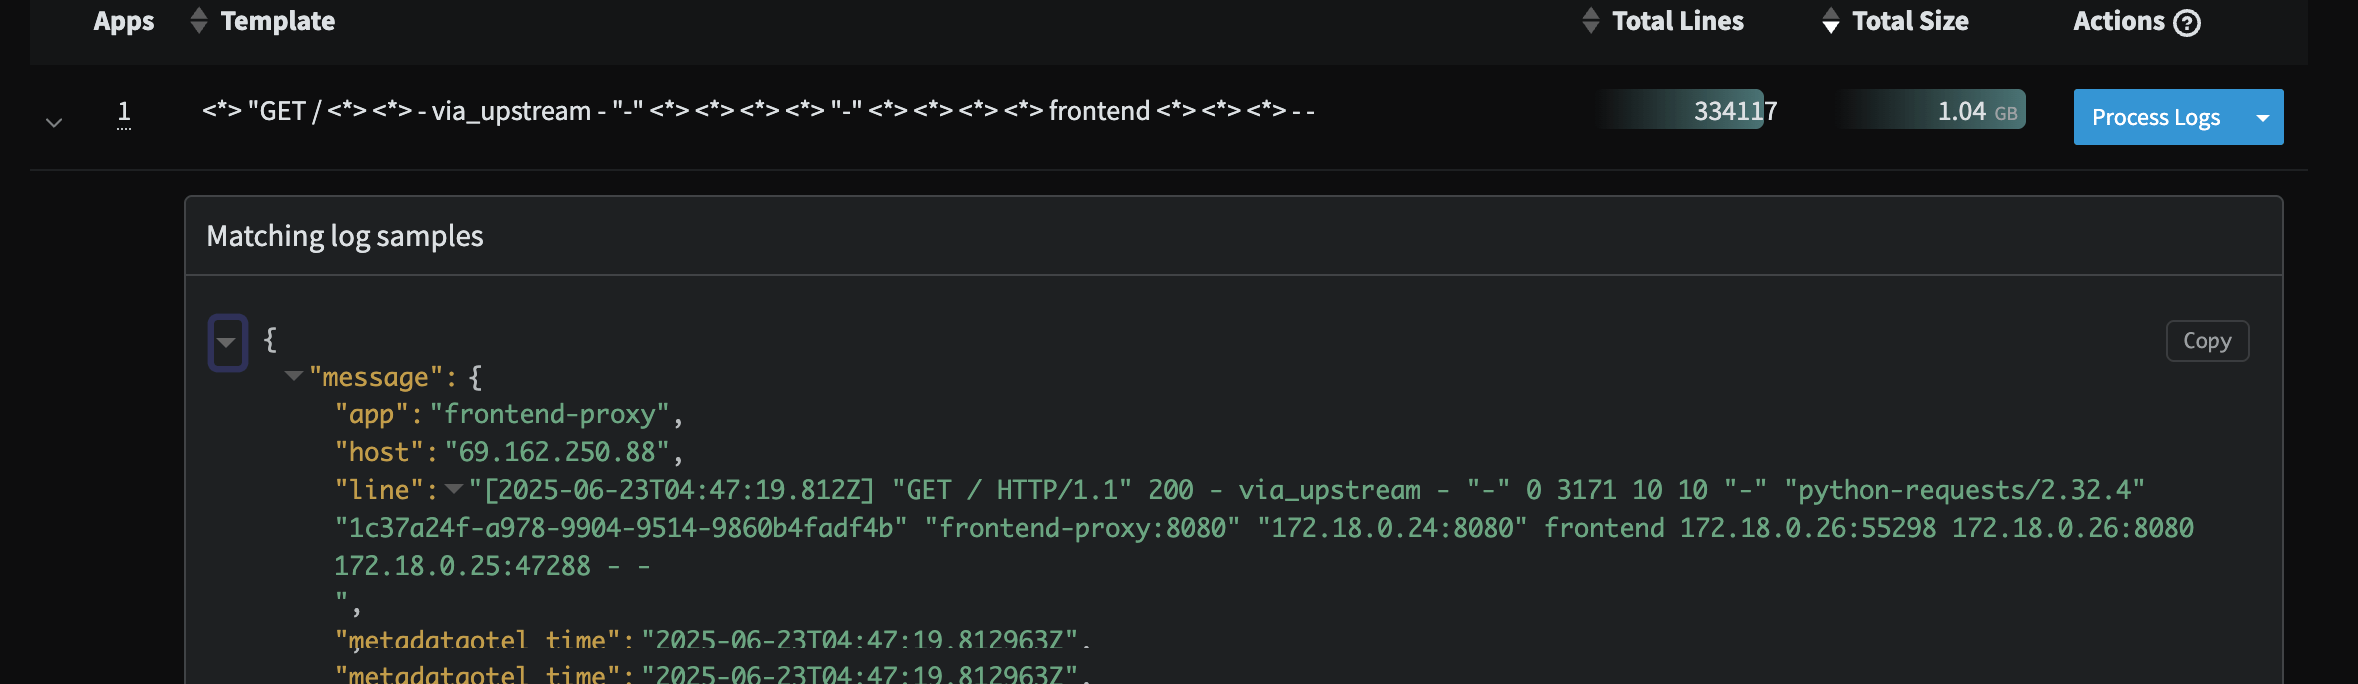
 2. There are unparsed events that appear to be custom Apache logs being sent from the `frontend-proxy` service. While these are [defined in the demo code here](https://github.com/mezmo/opentelemetry-demo/blob/main/src/frontend-proxy/envoy.tmpl.yaml#L80), we can take steps to make sure this data is structured and parsed properly to be searchable in any downstream Observability system.
 In the next step, you will build out a log telemetry pipeline to address both of these potential issues.