> ## Documentation Index
> Fetch the complete documentation index at: https://docs.mezmo.com/llms.txt
> Use this file to discover all available pages before exploring further.
# View Kubernetes Events and Metrics
> Use Kubernetes Enrichment to view cluster events, pod and node metrics, and logs in the Log Viewer, and tag lines to distinguish clusters.
Mezmo Kubernetes Enrichment centralizes Kubernetes events, resource metrics, and logs behind a single pane of glass to enable end-to-end visibility into your Kubernetes cluster. With Kubernetes Enrichment, you can troubleshoot deployment issues from within the Log Viewer, and view and set alerts for events like crashing pods or failing health checks in your production environments.
## Kubernetes Events
Knowing what is happening in your cluster alongside of your application log lines can be a valuable tool in debugging problems in your deployments. With the Mezmo Agent, you can now do this.
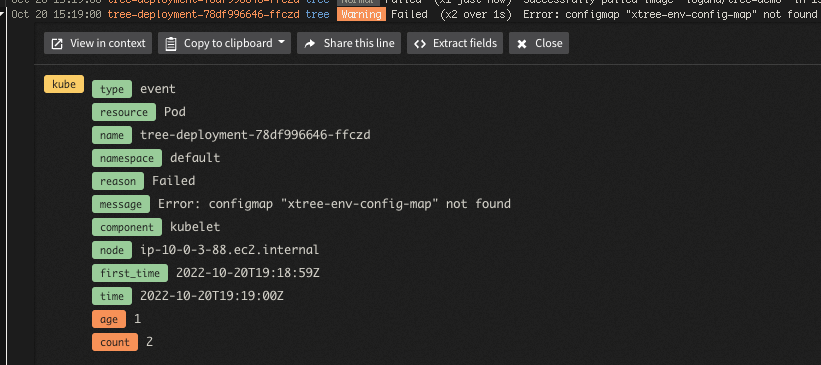 To set this up in your cluster, head over to our [setup instructions on GitHub](https://github.com/logdna/logdna-agent-v2/blob/master/docs/KUBERNETES.md#enabling-k8-events).
## Kubernetes Metrics Reporter Enriched Lines
This feature is only available for customers on an Enterprise plan, and is restricted to **Owner** and **Admin** user roles. Please contact your Customer Support Manager or [support@mezmo.com](mailto:support@mezmo.com) for more information.
The previous Mezmo Reporter that enabled metrics collection will soon be deprecated. We recommend all users to upgrade to the latest 3.7+ Mezmo Agent with built-in metrics support.
If you would like to see more detailed statistics about the pod your application is running on, edit your YAML config to enable metrics collection. With this feature, you can correlate performance issues with log lines that may be causing those issues. Please note that non-enterprise customers will still incur the costs of storing metrics, but without the ability to see the metrics in Log Viewer.
After you enabling this feature, you can start viewing Kubernetes metrics in the Log Viewer. These metrics and metadata all show a point-in-time capture of the Kubernetes cluster state when that log line was sent, so even if an event happened a few days ago, the metrics will still reflect what was happening during that event.
1. In the Mezmo Web App, under **Views**, select a view that contains lines from your Kubernetes cluster.
2. Click the arrow next to a log line to open the information pane for that line.
3. Click the arrow next to **Kube Stats** to view metrics including CPU usage and memory for the pod and node associated with the log entry. All metrics have the same retention as your log retention, and metrics are collected every 30 seconds.
To set this up in your cluster, head over to our [setup instructions on GitHub](https://github.com/logdna/logdna-agent-v2/blob/master/docs/KUBERNETES.md#enabling-k8-events).
## Kubernetes Metrics Reporter Enriched Lines
This feature is only available for customers on an Enterprise plan, and is restricted to **Owner** and **Admin** user roles. Please contact your Customer Support Manager or [support@mezmo.com](mailto:support@mezmo.com) for more information.
The previous Mezmo Reporter that enabled metrics collection will soon be deprecated. We recommend all users to upgrade to the latest 3.7+ Mezmo Agent with built-in metrics support.
If you would like to see more detailed statistics about the pod your application is running on, edit your YAML config to enable metrics collection. With this feature, you can correlate performance issues with log lines that may be causing those issues. Please note that non-enterprise customers will still incur the costs of storing metrics, but without the ability to see the metrics in Log Viewer.
After you enabling this feature, you can start viewing Kubernetes metrics in the Log Viewer. These metrics and metadata all show a point-in-time capture of the Kubernetes cluster state when that log line was sent, so even if an event happened a few days ago, the metrics will still reflect what was happening during that event.
1. In the Mezmo Web App, under **Views**, select a view that contains lines from your Kubernetes cluster.
2. Click the arrow next to a log line to open the information pane for that line.
3. Click the arrow next to **Kube Stats** to view metrics including CPU usage and memory for the pod and node associated with the log entry. All metrics have the same retention as your log retention, and metrics are collected every 30 seconds.

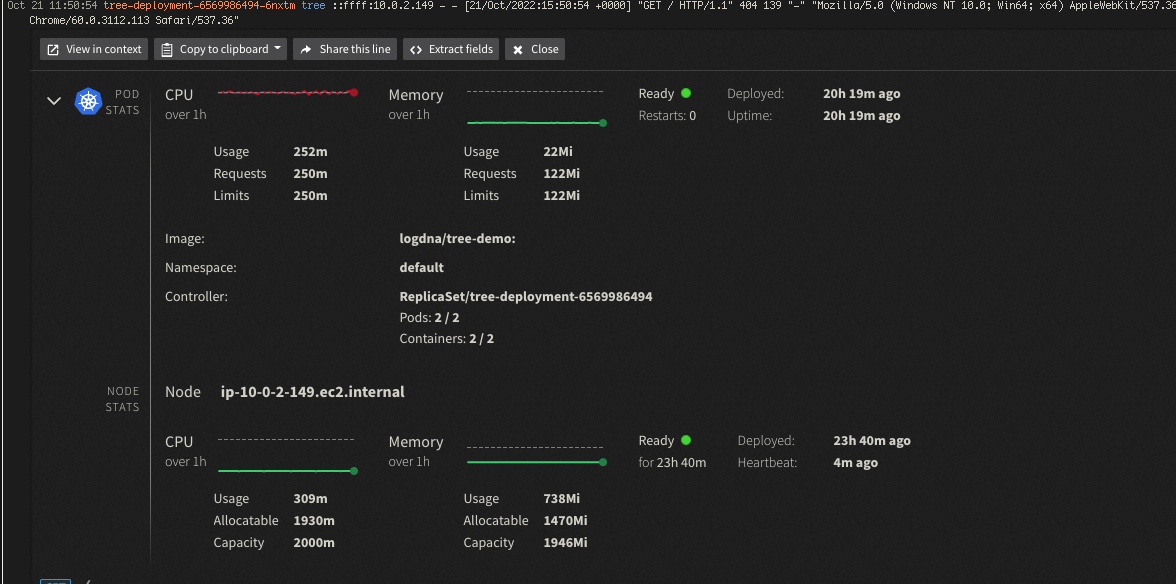 Other information you can view includes:
* Events associated with the log line
* Line identifiers
* Labels
* Diagnostics
## Cluster Tag to Distinguish between Multiple Clusters
When you are sending log lines to Mezmo from multiple similarly named namespaces and pods you will need to add a value to the `MZ_TAGS` environment variable.
Please add a tag that is prefixed `k8sclusterkey` (for example `k8sclusterkey_prod-clstr` where `prod-clstr `is a unique cluster name). This will allow enrichment to distinguish between the clusters when the nodes are similarly named.
This will also add a new line identifier called `Cluster` to your log lines that you can search for.
Other information you can view includes:
* Events associated with the log line
* Line identifiers
* Labels
* Diagnostics
## Cluster Tag to Distinguish between Multiple Clusters
When you are sending log lines to Mezmo from multiple similarly named namespaces and pods you will need to add a value to the `MZ_TAGS` environment variable.
Please add a tag that is prefixed `k8sclusterkey` (for example `k8sclusterkey_prod-clstr` where `prod-clstr `is a unique cluster name). This will allow enrichment to distinguish between the clusters when the nodes are similarly named.
This will also add a new line identifier called `Cluster` to your log lines that you can search for.