> ## Documentation Index
> Fetch the complete documentation index at: https://docs.mezmo.com/llms.txt
> Use this file to discover all available pages before exploring further.
# Trace Data Optimization Pipeline
> Build a Mezmo pipeline that enriches, state-routes, and samples OpenTelemetry traces to cut volume while preserving incident fidelity.
***
## Step 1: Create a new Pipeline to handle and route OpenTelemetry Traces
Create a new Mezmo Pipeline by clicking [New Pipeline](https://app.mezmo.com/pipelines/pipeline/new) in the platform. Give this a name like `Trace Handler`. Select Create Blank Pipeline then Continue.
## Step 2: Add OpenTelemetry Trace Source
Click `Add Source` and select your OpenTelemetry Trace source from the `Shared Sources` list similar to before.
## Step 3: Insert State Enrichment
We will add the script to enrich each trace with the current pipelines operational state to be able to take advantage of [Responsive Pipelines](/telemetry-pipelines/configure-responsive-pipelines) in the future by. Click the `three dots` on your Otel Trace Source and select `Add Node->Add Processor->Script Execution`.
Paste in the following JavaScript and click `Save`. Note that the script does a bit more than add the `operational_state` state variable by tagging this data in-flight.
```javascript theme={null}
function processEvent(message, metadata, timestamp, annotations) {
const state = getPipelineStateVariable("operational_state")
message.op_state = state
message.name = message.name.toString()
message.tags.op_state = state
metadata.resource.attributes["pipeline.path"] = "with_mezmo"
if( message == null ){ return null }
return message
}
```
## Step 4: Route Based on State
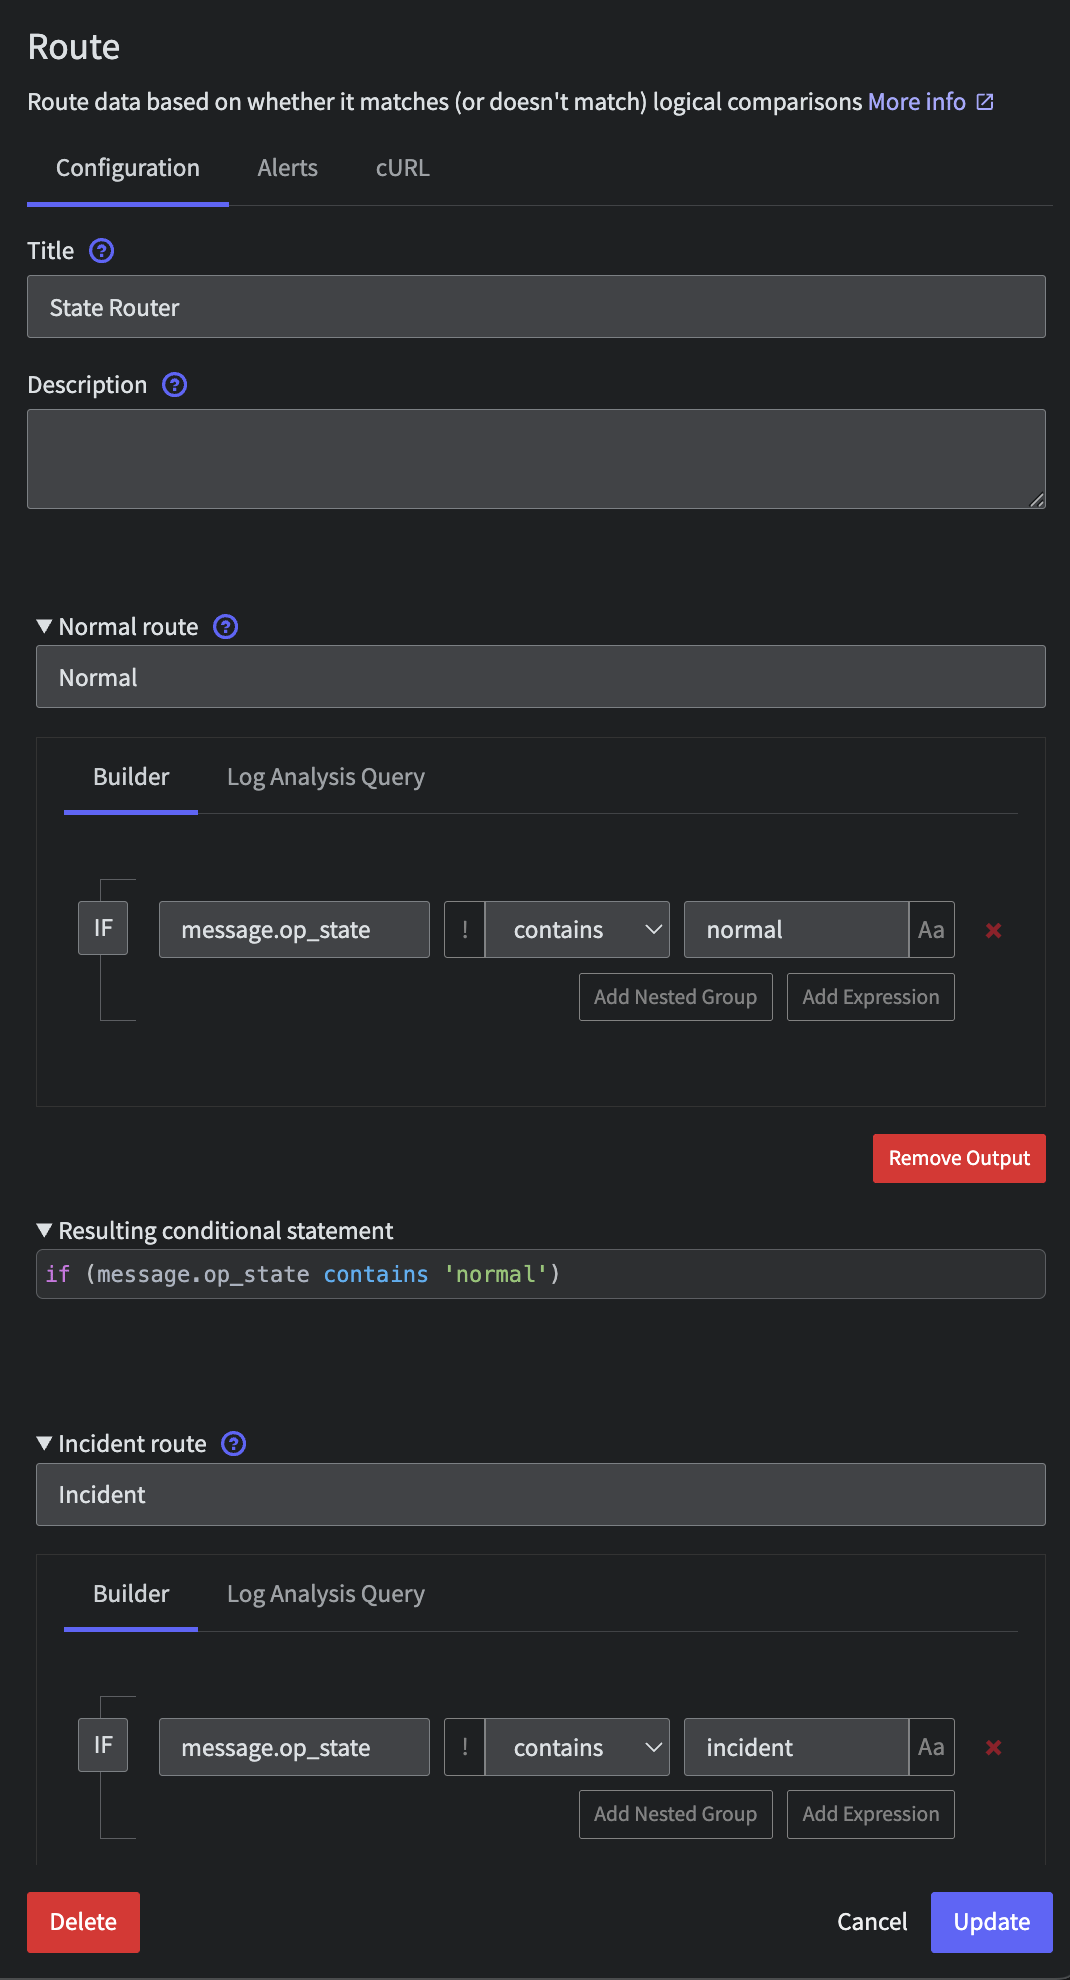
After the initial Enrichment processor, let's route the data flow based on that `operational_state`. Connect a Route processor to the Enrichment Script with the following configuration:
* Title: `State Router`
* Route 1:
* Title: `Normal`
* Criteria: `message.op_state` `contains` `normal`
* Route 2:
* Title: `Incident`
* Criteria: `message.op_state` `contains` `incident`
* Route 3:
* Title: `Deploy`
* Criteria: `message.op_state` `contains` `deploy`
You will end up with a pipeline that looks like the following
 ## Step 5: Sample Traces in Normal State
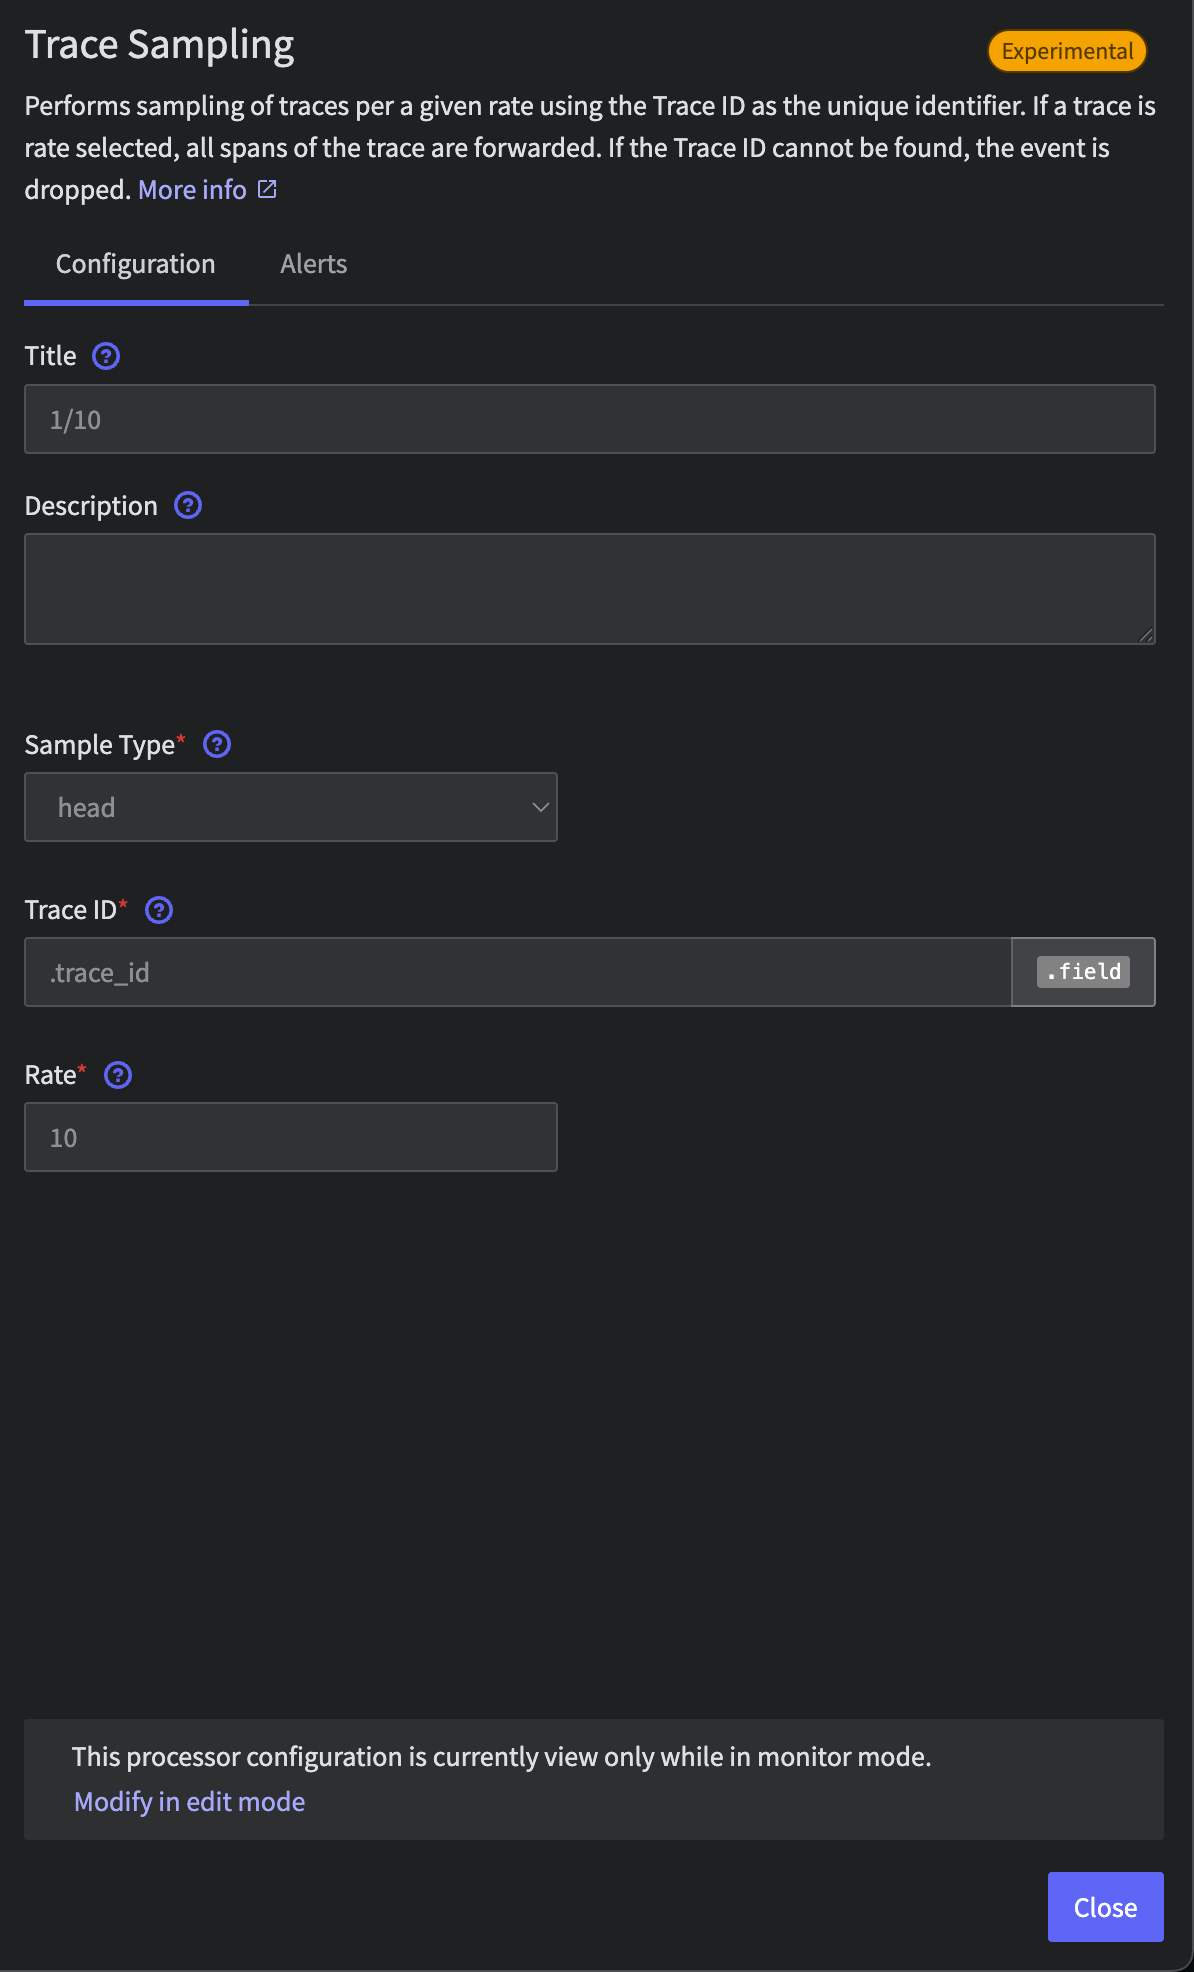
Add a 1/10 Trace Sample processor connected to the Normal and Unmatched routes with the following configuration:
* Rate: `10`
## Step 5: Sample Traces in Normal State
Add a 1/10 Trace Sample processor connected to the Normal and Unmatched routes with the following configuration:
* Rate: `10`
 Note that Tail-based sampling is also available in Beta.
## Step 6: Sending Data Downstream Systems
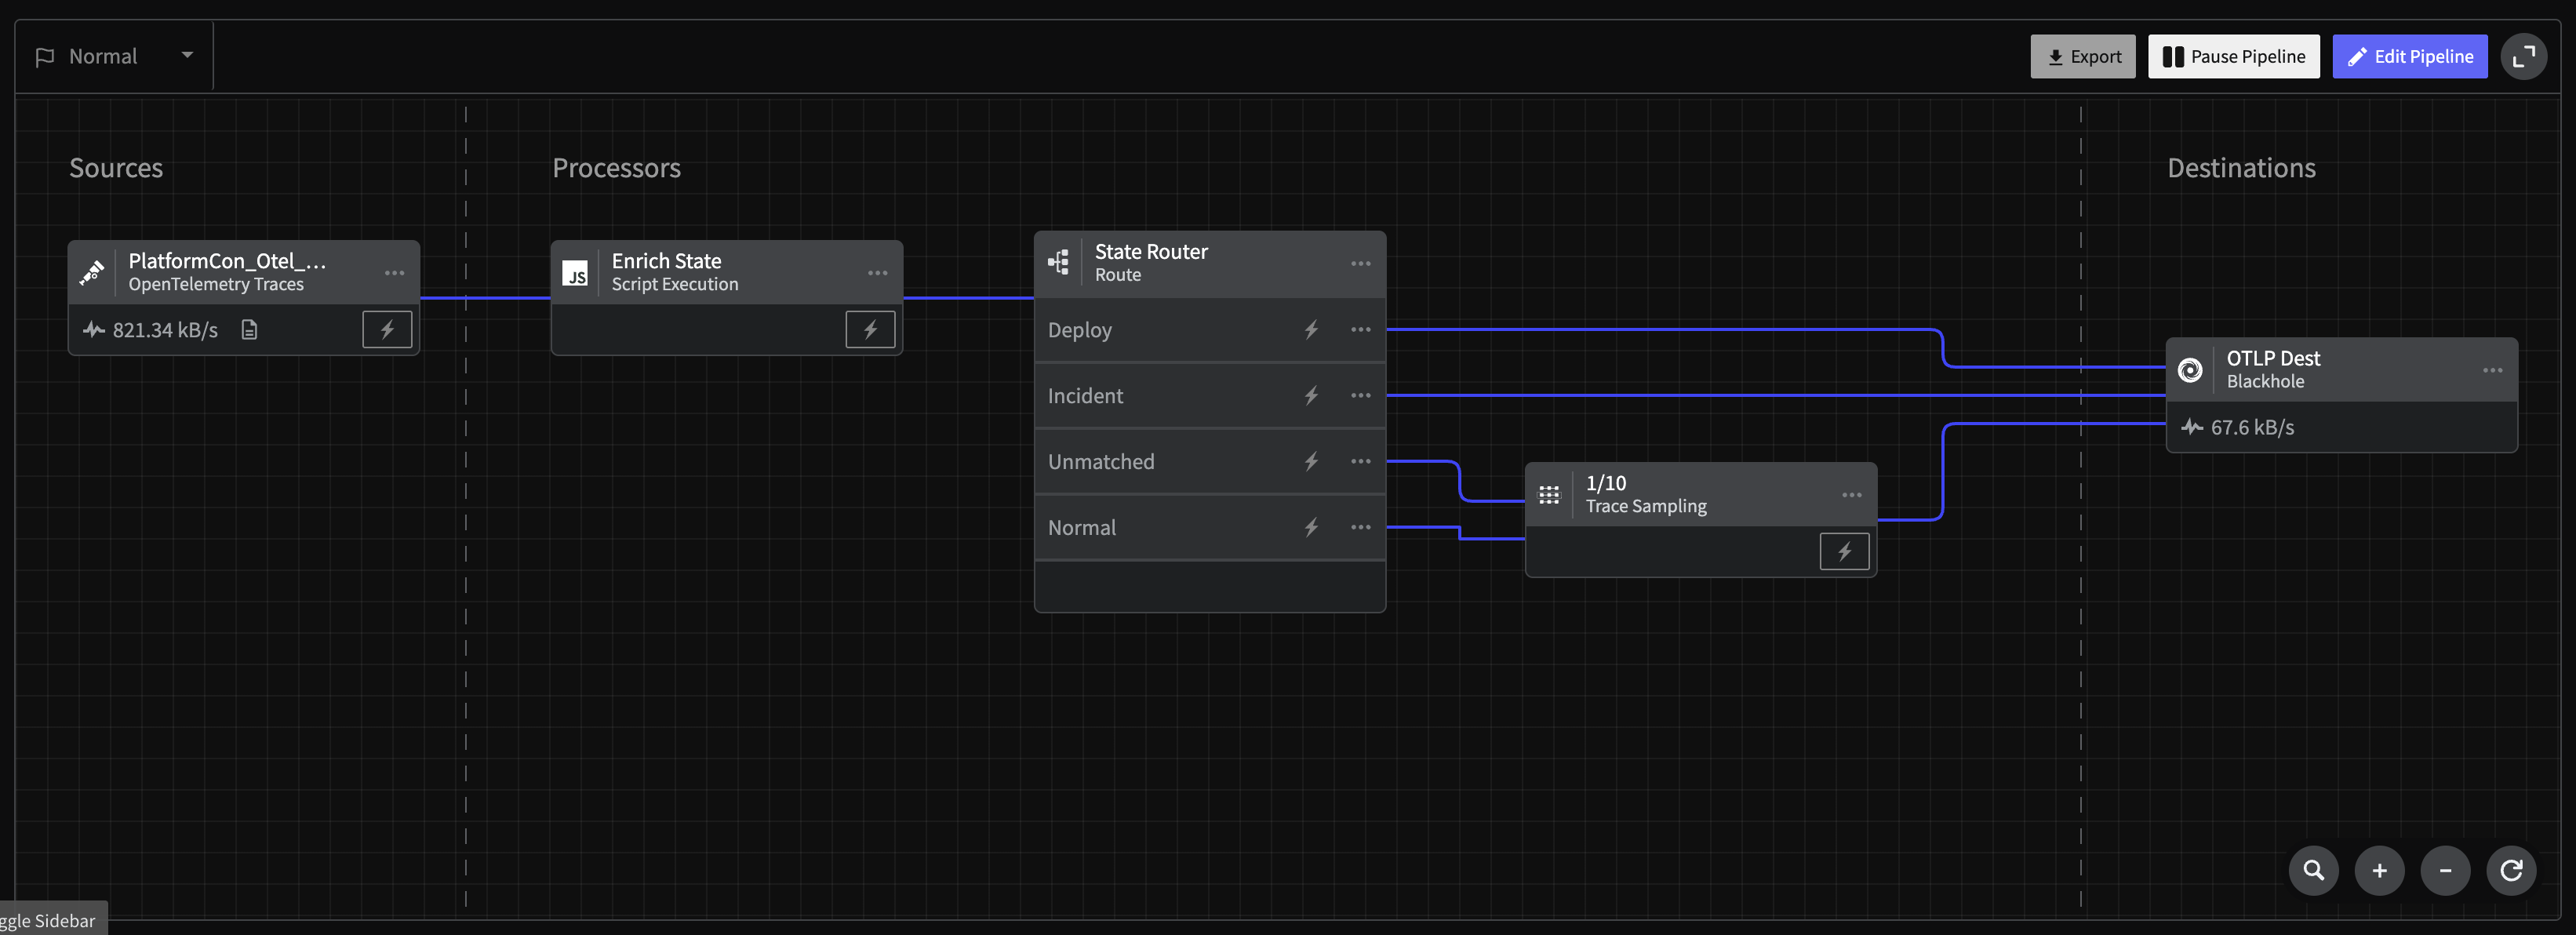
Now, connect all outputs to a Blackhole destination. This is simply a placeholder for any Observability system you'd like. Explore our destinations in-app or in our [docs](/telemetry-pipelines/supported-telemetry-data-destinations) to easily send telemetry data downstream into tools, data lakes and more.
Note that Tail-based sampling is also available in Beta.
## Step 6: Sending Data Downstream Systems
Now, connect all outputs to a Blackhole destination. This is simply a placeholder for any Observability system you'd like. Explore our destinations in-app or in our [docs](/telemetry-pipelines/supported-telemetry-data-destinations) to easily send telemetry data downstream into tools, data lakes and more.
 ## Step 7: Deploy
Finally, you must deploy your pipeline in order to begin applying the trace reductions.
## Step 8: Initiate State and Grab State ID
Same as with the Logs, let's initiate the State and save the `State ID` of this pipeline for later.
First, flip the State in the UX from Normal to Incident and back to Normal to initialize.
Then, in your terminal run the following command with the metric `pipeline's ID` and grab that `State ID`.
```bash theme={null}
curl --request GET \
--url 'https://api.mezmo.com/v3/pipeline/state-variable?pipeline_id=PIPELINE_ID' \
--header 'Authorization: Token PIPELINE_API_KEY'
```
## Step 7: Deploy
Finally, you must deploy your pipeline in order to begin applying the trace reductions.
## Step 8: Initiate State and Grab State ID
Same as with the Logs, let's initiate the State and save the `State ID` of this pipeline for later.
First, flip the State in the UX from Normal to Incident and back to Normal to initialize.
Then, in your terminal run the following command with the metric `pipeline's ID` and grab that `State ID`.
```bash theme={null}
curl --request GET \
--url 'https://api.mezmo.com/v3/pipeline/state-variable?pipeline_id=PIPELINE_ID' \
--header 'Authorization: Token PIPELINE_API_KEY'
```