> ## Documentation Index
> Fetch the complete documentation index at: https://docs.mezmo.com/llms.txt
> Use this file to discover all available pages before exploring further.
# Metrics Data Optimization Pipeline
> Build a Mezmo pipeline that enriches, state-routes, aggregates, and limits cardinality on OpenTelemetry metrics to reduce volume.
***
## Step 1: Create a new Pipeline to handle and route OpenTelemetry Metrics
Create a new Mezmo Pipeline by clicking [New Pipeline](https://app.mezmo.com/pipelines/pipeline/new) in the platform. Give this a name like `Metric Handler`, select Create Blank Pipeline, then select Continue at the bottom.
## Step 2: Add OpenTelemetry Metric Source
Click `Add Source` and select your OpenTelemetry Metric source from the `Shared Sources` list similar to before.
## Step 3: Insert State Enrichment
As we did with the previous pipeline, we will prepare the data to take advantage of [Responsive Pipelines](/telemetry-pipelines/configure-responsive-pipelines) in the future by enriching each metric with the current pipelines operational state. Click the `three dots` on your Otel Metric Source and select `Add Node->Add Processor->Script Execution`.
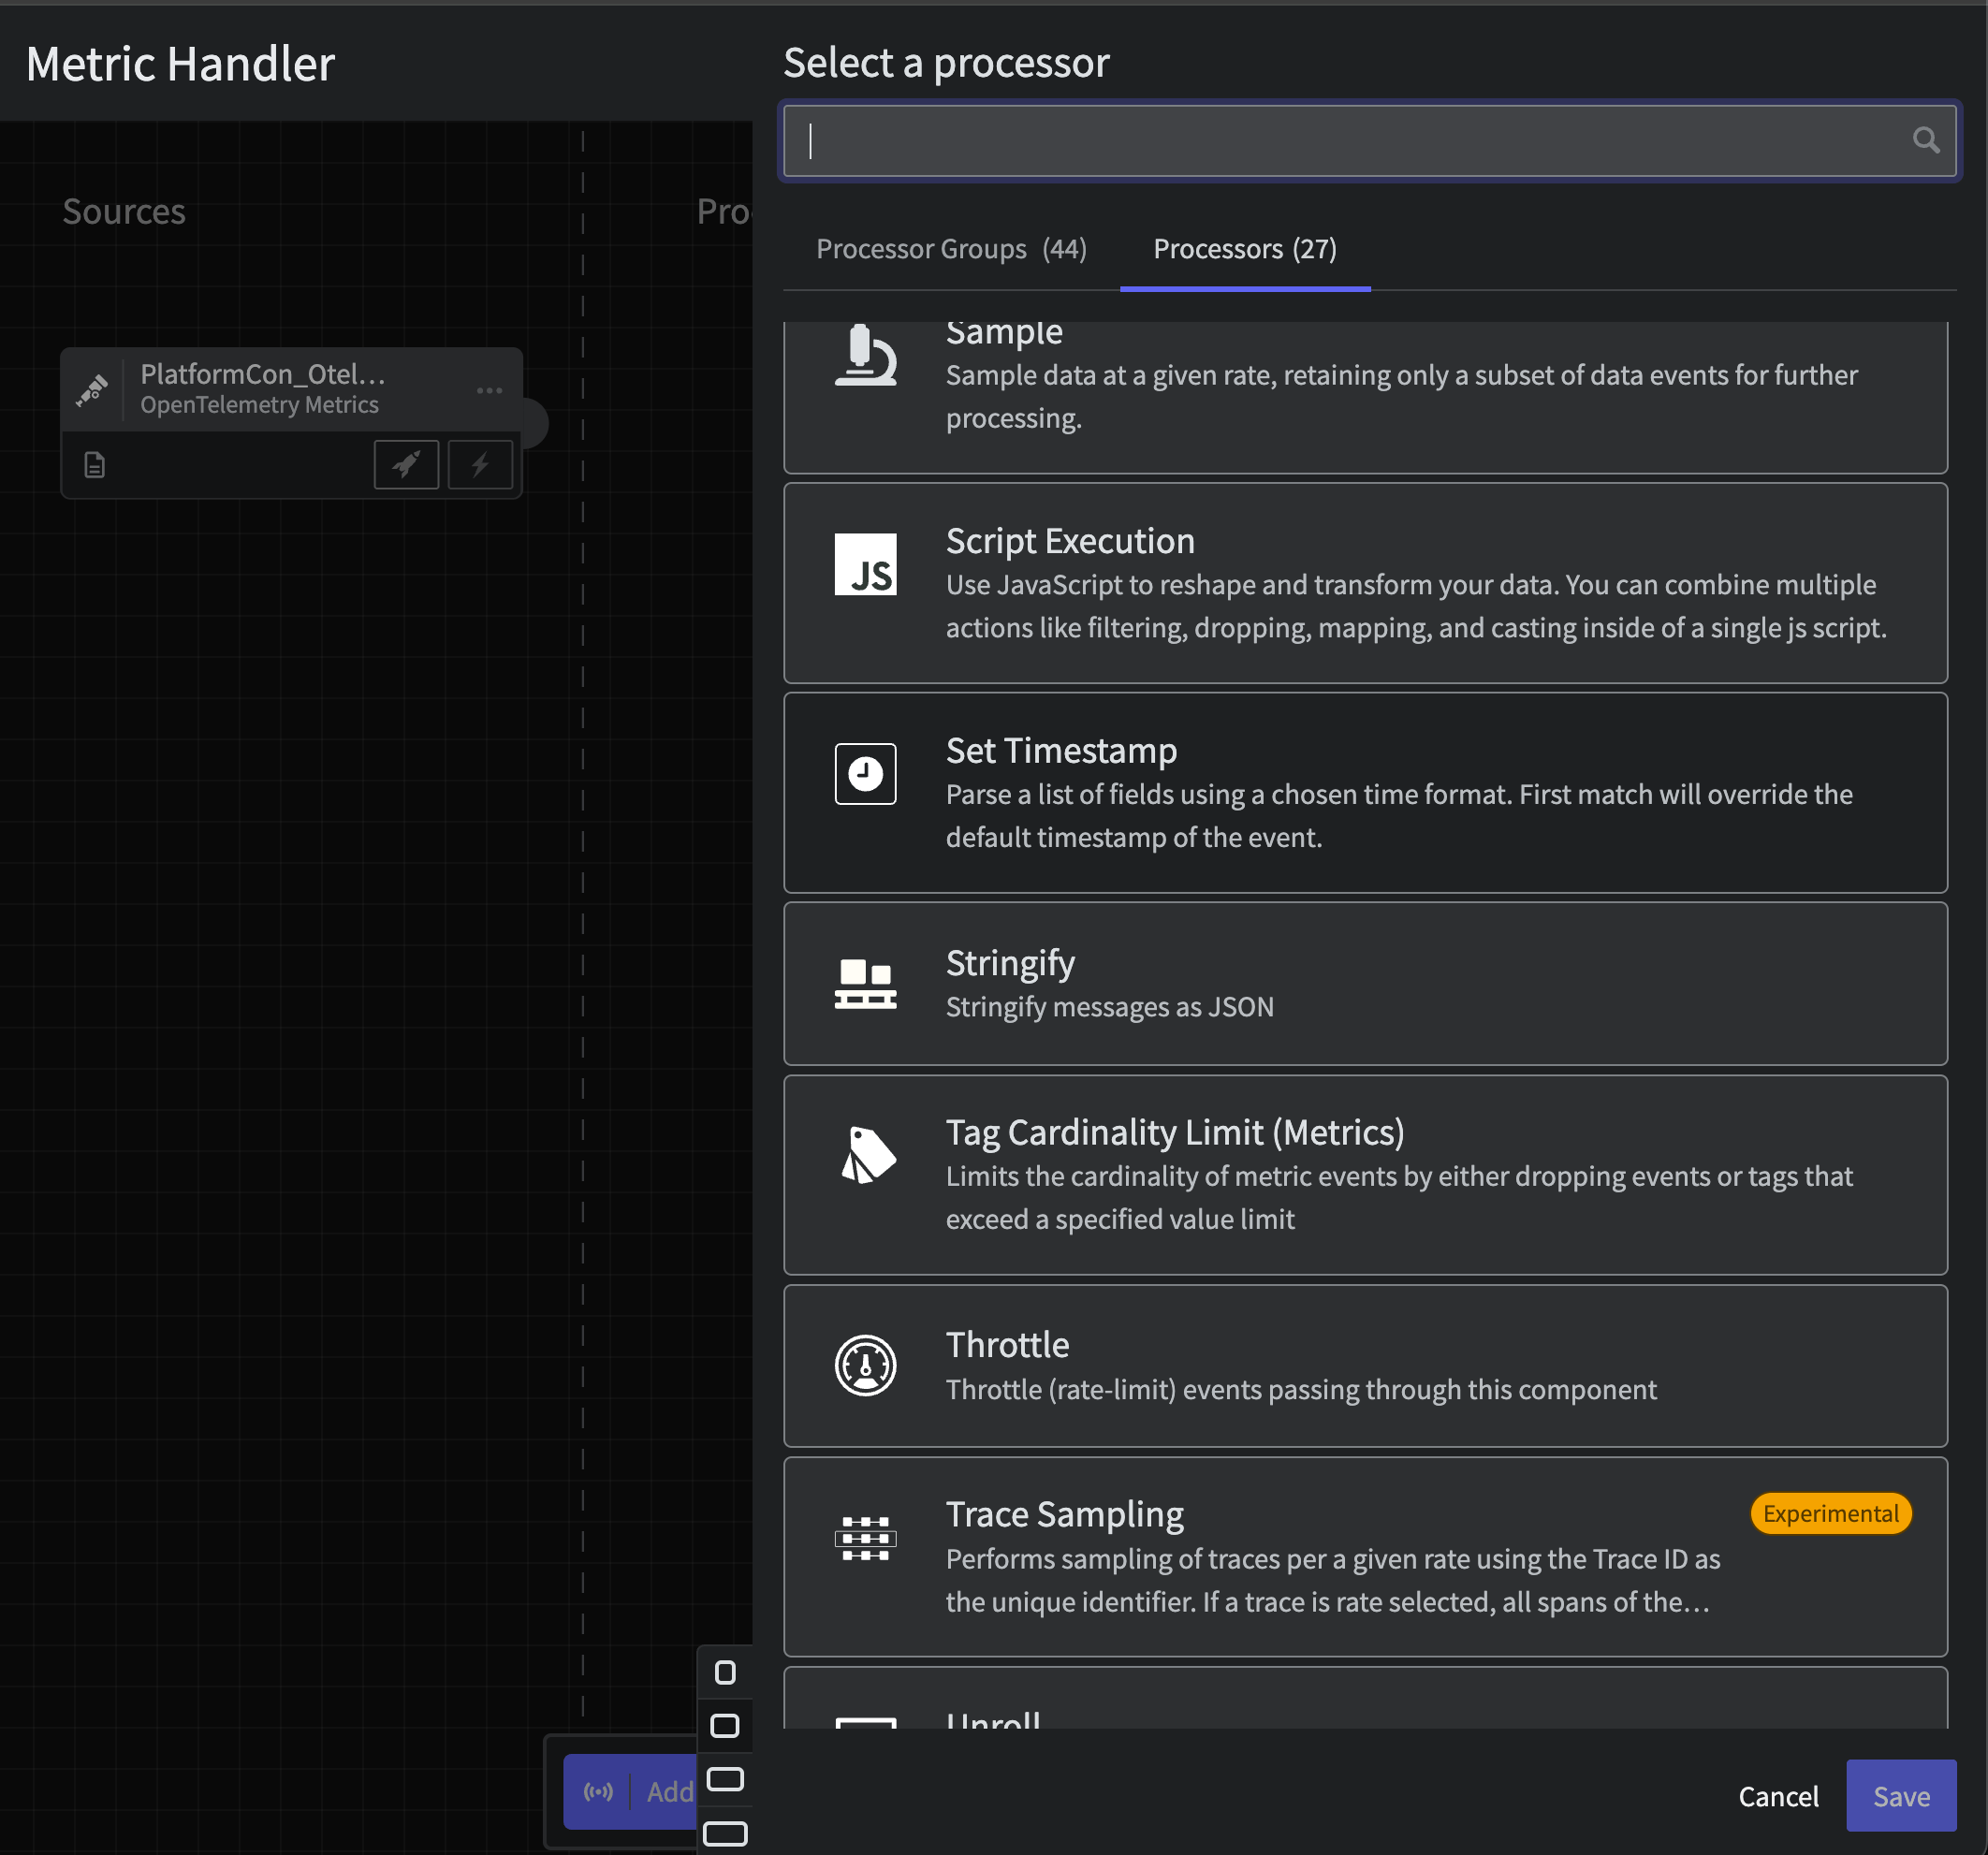 Paste in the following JavaScript and click `Save`. Note that the script does a bit more than add the `operational_state` state variable by tagging this data in-flight.
```javascript theme={null}
function processEvent(message, metadata, timestamp, annotations) {
const state = getPipelineStateVariable("operational_state")
message.op_state = state
message.name = message.name.toString()
message.tags.op_state = state
metadata.resource.attributes["pipeline.path"] = "with_mezmo"
if( message == null ){ return null }
return message
}
```
## Step 4: Route Based on State
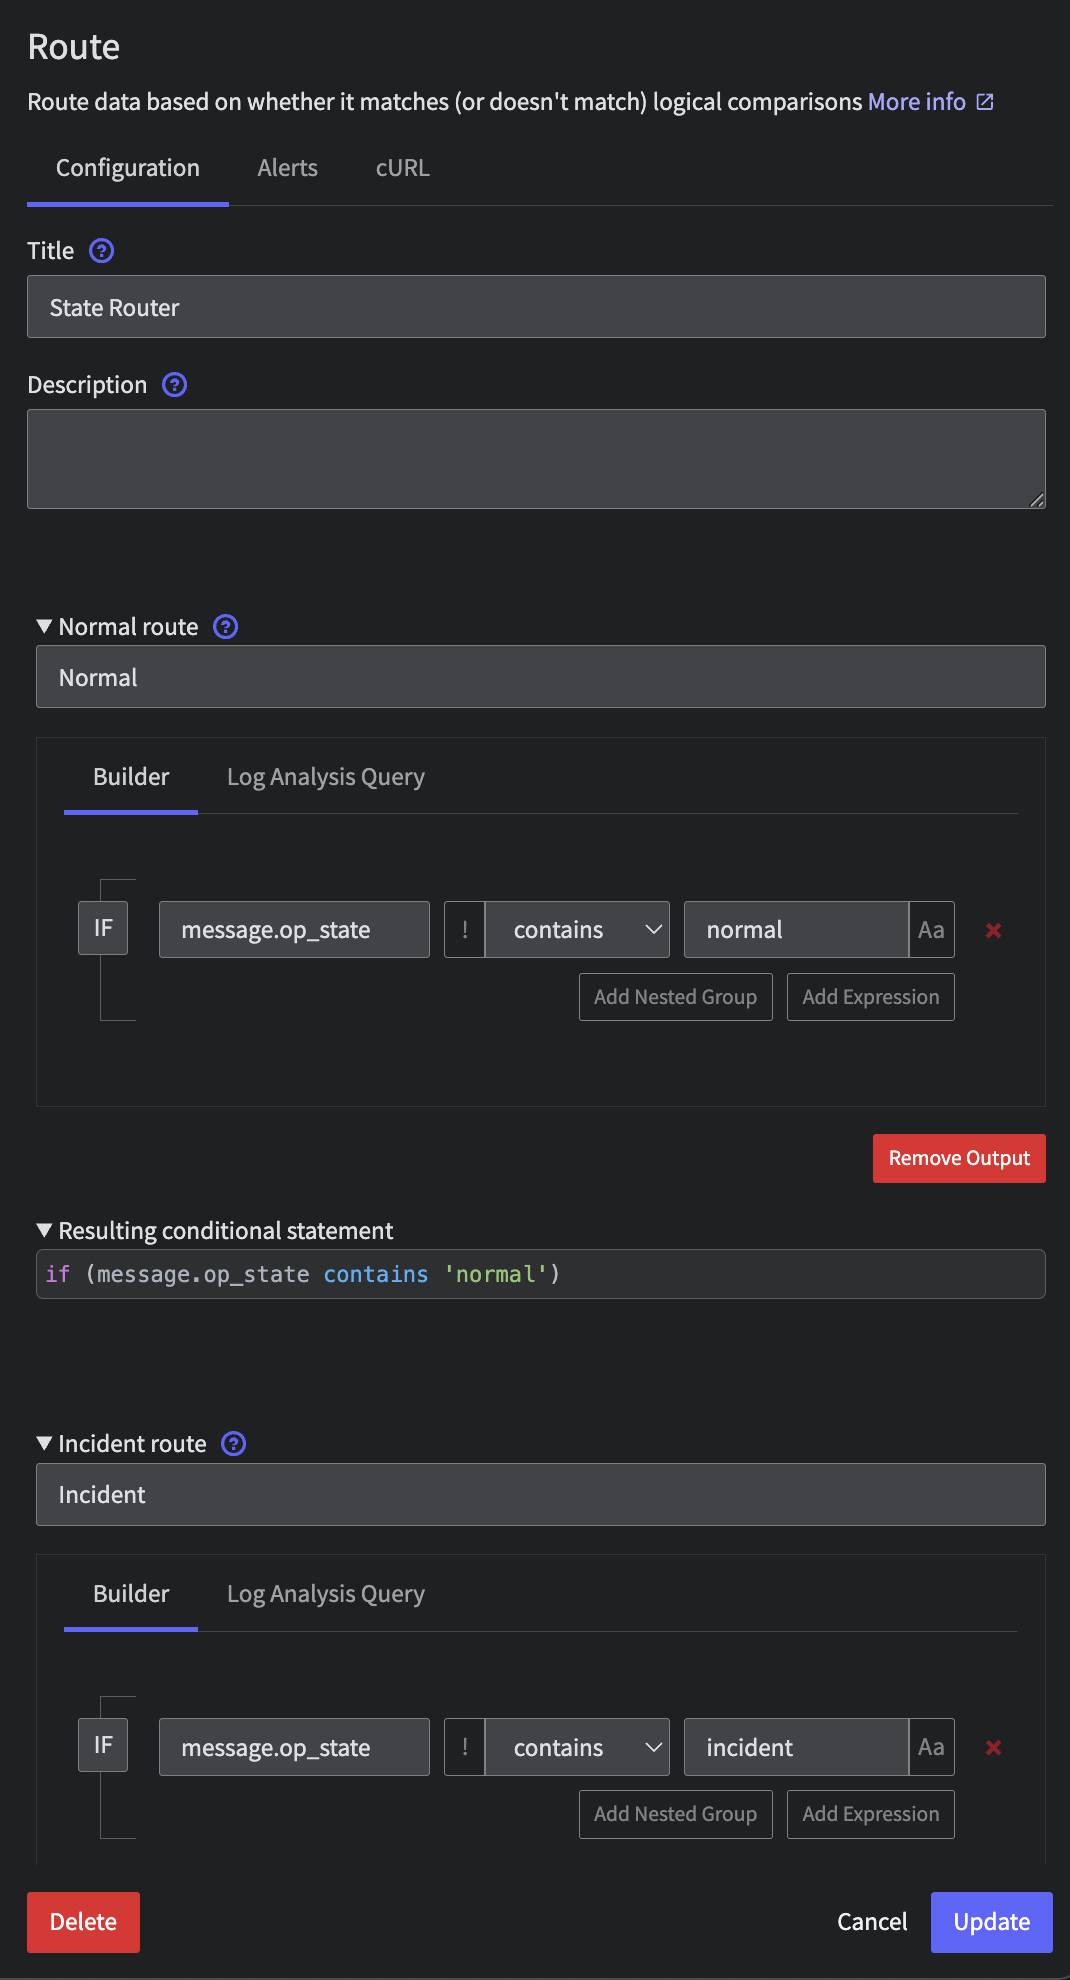
After the initial Enrichment processor, let's route the data flow based on that `operational_state`. Connect a Route processor to the Enrichment Script with the following configuration:
* Title: `State Router`
* Route 1:
* Title: `Normal`
* Criteria: `message.op_state` `contains` `normal`
* Route 2:
* Title: `Incident`
* Criteria: `message.op_state` `contains` `incident`
* Route 3:
* Title: `Deploy`
* Criteria: `message.op_state` `contains` `deploy`
You will end up with a pipeline that looks like the following
Paste in the following JavaScript and click `Save`. Note that the script does a bit more than add the `operational_state` state variable by tagging this data in-flight.
```javascript theme={null}
function processEvent(message, metadata, timestamp, annotations) {
const state = getPipelineStateVariable("operational_state")
message.op_state = state
message.name = message.name.toString()
message.tags.op_state = state
metadata.resource.attributes["pipeline.path"] = "with_mezmo"
if( message == null ){ return null }
return message
}
```
## Step 4: Route Based on State
After the initial Enrichment processor, let's route the data flow based on that `operational_state`. Connect a Route processor to the Enrichment Script with the following configuration:
* Title: `State Router`
* Route 1:
* Title: `Normal`
* Criteria: `message.op_state` `contains` `normal`
* Route 2:
* Title: `Incident`
* Criteria: `message.op_state` `contains` `incident`
* Route 3:
* Title: `Deploy`
* Criteria: `message.op_state` `contains` `deploy`
You will end up with a pipeline that looks like the following
 ## Step 5: Normalize and Aggregate in Normal State
A common approach to reduce Metric data volumes is to aggregate those metrics and reduce their cardinality. Mezmo makes this incredibly easy with intuitive processors. We will implement a 5 min aggregation on all incoming metrics and trim off the tags being used. Connected to your `Normal` and `Unmatched` outputs from the `State Router`, add a `Script Execution` processor with the following script:
```javascript theme={null}
function processEvent(message, metadata, timestamp, annotations) {
let service_name = message.tags.service_name
let host_id = message.tags.host_id
if( service_name == null ){
service_name = metadata.resource.attributes['service.name']
}
if( service_name == null ){ service_name = 'NA' }
if( host_id == null ){
host_id = metadata.resource.attributes['host.id']
}
if( host_id == null ){ host_id = 'NA' }
message.tags = {
'service_name': service_name,
'host_id': host_id
}
return message
}
```
Next, we will limit the cardinality of that `host_id` tag to 10 by connecting a `Tag Cardinality Limit` processor with the following configuration:
* Tags: `message.tags.host_id`
* Action: `drop_tag`
* Value Limit: `10`
* Mode: `Probablistic`
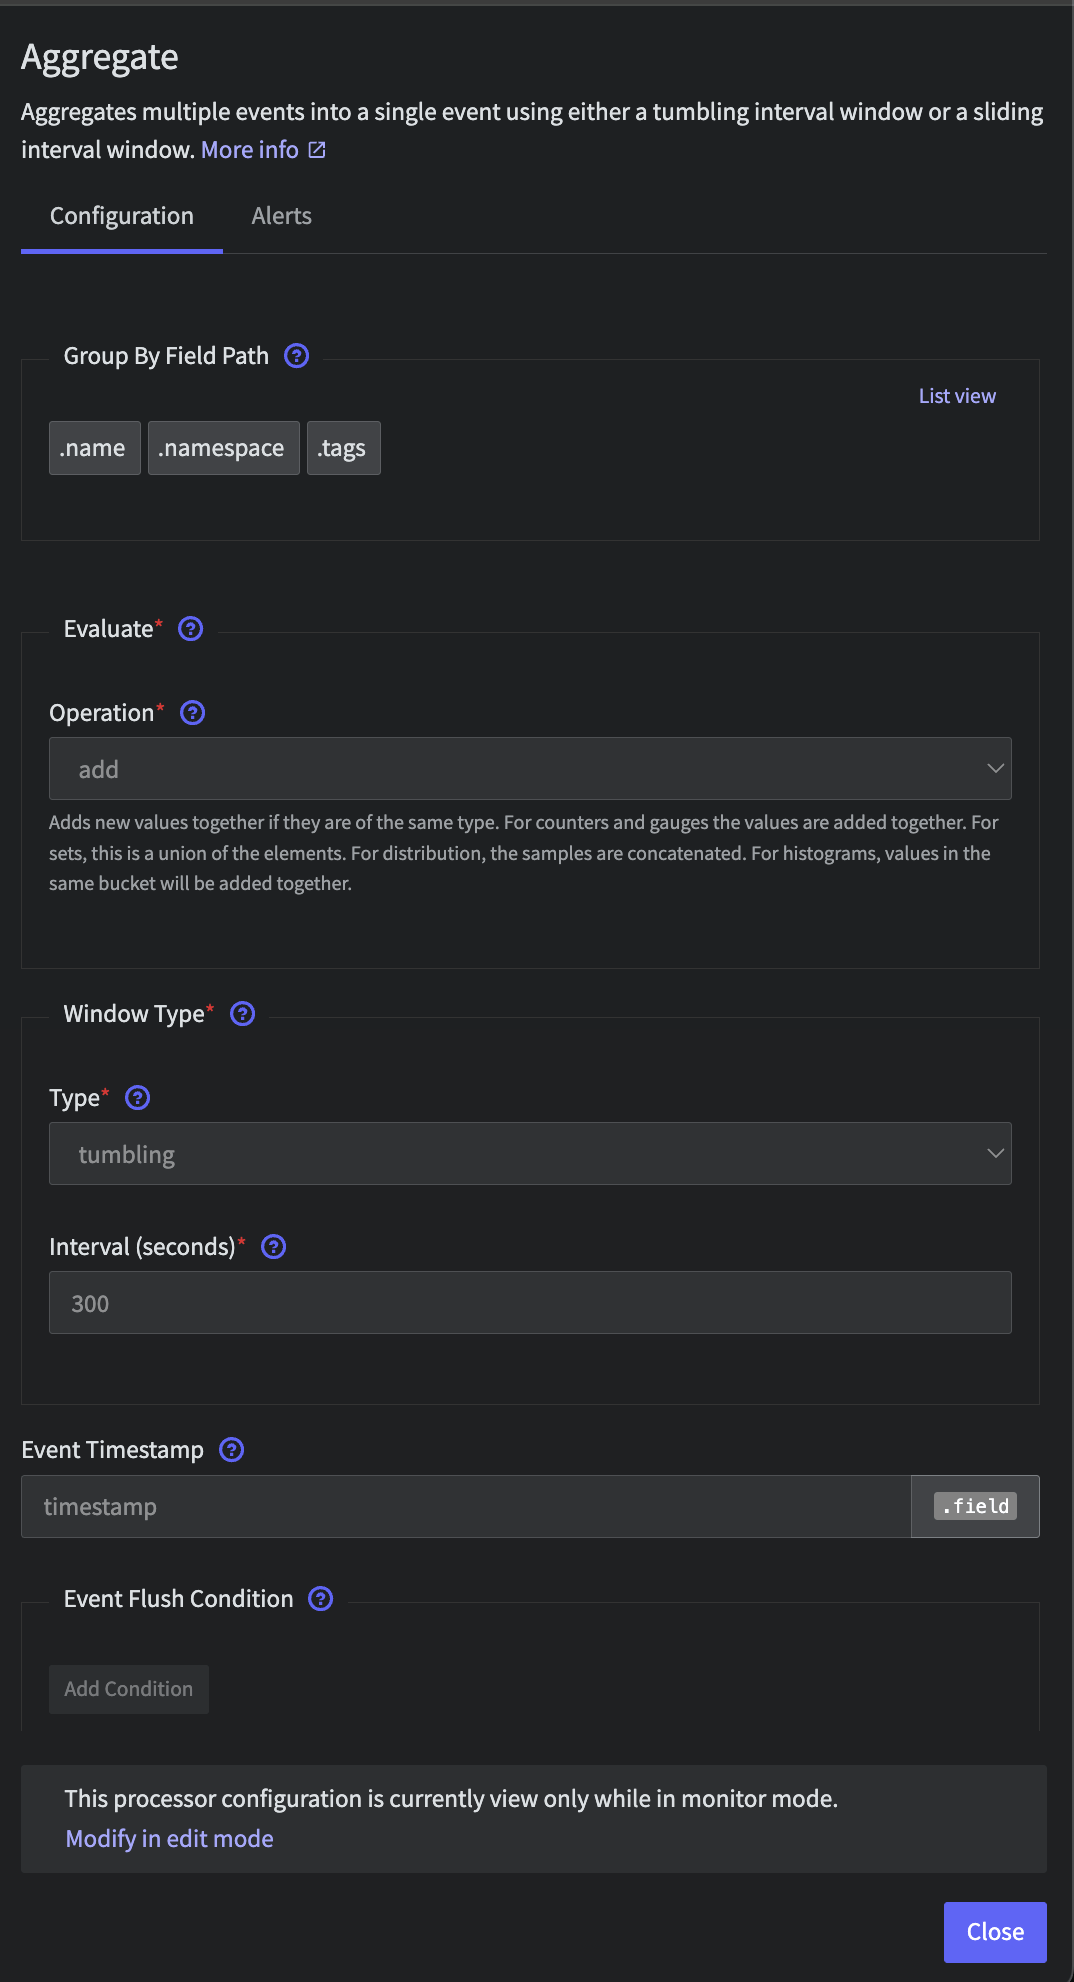
Finally, let's aggregate on a 5 min window by adding an `Aggregate` processor. Leave the default configuration, only changing the following:
* Interval (seconds): `300`
## Step 5: Normalize and Aggregate in Normal State
A common approach to reduce Metric data volumes is to aggregate those metrics and reduce their cardinality. Mezmo makes this incredibly easy with intuitive processors. We will implement a 5 min aggregation on all incoming metrics and trim off the tags being used. Connected to your `Normal` and `Unmatched` outputs from the `State Router`, add a `Script Execution` processor with the following script:
```javascript theme={null}
function processEvent(message, metadata, timestamp, annotations) {
let service_name = message.tags.service_name
let host_id = message.tags.host_id
if( service_name == null ){
service_name = metadata.resource.attributes['service.name']
}
if( service_name == null ){ service_name = 'NA' }
if( host_id == null ){
host_id = metadata.resource.attributes['host.id']
}
if( host_id == null ){ host_id = 'NA' }
message.tags = {
'service_name': service_name,
'host_id': host_id
}
return message
}
```
Next, we will limit the cardinality of that `host_id` tag to 10 by connecting a `Tag Cardinality Limit` processor with the following configuration:
* Tags: `message.tags.host_id`
* Action: `drop_tag`
* Value Limit: `10`
* Mode: `Probablistic`
Finally, let's aggregate on a 5 min window by adding an `Aggregate` processor. Leave the default configuration, only changing the following:
* Interval (seconds): `300`
 ## Step 6: Sending Data Downstream Systems
Now, connect all outputs to a Blackhole destination. This is simply a placeholder for any Observability system you'd like. Explore our destinations in-app or in our [docs](/telemetry-pipelines/supported-telemetry-data-destinations) to easily send telemetry data downstream into tools, data lakes and more.
You should have a pipeline that looks like the following.
## Step 6: Sending Data Downstream Systems
Now, connect all outputs to a Blackhole destination. This is simply a placeholder for any Observability system you'd like. Explore our destinations in-app or in our [docs](/telemetry-pipelines/supported-telemetry-data-destinations) to easily send telemetry data downstream into tools, data lakes and more.
You should have a pipeline that looks like the following.
 ## Step 7: Deploy
Finally, you must deploy your pipeline in order to start taking advantage of your metric optimizations.
## Step 8: Initiate State and Grab State ID
Same as with the Logs, let's initiate the State and save the `State ID` of this pipeline for later.
First, flip the State in the UX from Normal to Incident and back to Normal to initialize.
Then, in your terminal window, run the following command with the metric `pipeline's ID` and grab that `State ID`.
```bash theme={null}
curl --request GET \
--url 'https://api.mezmo.com/v3/pipeline/state-variable?pipeline_id=PIPELINE_ID' \
--header 'Authorization: Token PIPELINE_API_KEY'
```
## Step 7: Deploy
Finally, you must deploy your pipeline in order to start taking advantage of your metric optimizations.
## Step 8: Initiate State and Grab State ID
Same as with the Logs, let's initiate the State and save the `State ID` of this pipeline for later.
First, flip the State in the UX from Normal to Incident and back to Normal to initialize.
Then, in your terminal window, run the following command with the metric `pipeline's ID` and grab that `State ID`.
```bash theme={null}
curl --request GET \
--url 'https://api.mezmo.com/v3/pipeline/state-variable?pipeline_id=PIPELINE_ID' \
--header 'Authorization: Token PIPELINE_API_KEY'
```