> ## Documentation Index
> Fetch the complete documentation index at: https://docs.mezmo.com/llms.txt
> Use this file to discover all available pages before exploring further.
# Profiling Log Data
> Build an exploration pipeline with the Mezmo Data Profiler to surface high-volume and unparsed log patterns in the OpenTelemetry Demo.
***
## Why it matters
The Mezmo [Data Profiler](/telemetry-pipelines/data-profiling) gives teams real-time visibility into the shape and quality of their telemetry data as it flows through the pipeline. It automatically surfaces schemas, cardinality, and value distributions to highlight noisy, inconsistent, or high-cost fields. With these insights, teams can make informed decisions on filtering, redaction, and enrichment—optimizing both observability costs and the usefulness of their data.
The Data Profiler currently works with log data. It categorizes this data by app, host, level, and type, based on how the processor is configured. It will also identify other fields and report on their cardinality. To build a Data Profile report, you'll need a pipeline with the Data Profiler processor in it. Mezmo recommends that this pipeline be separate from pipelines that feed your observability destinations, as the Data Profiler adds additional annotation data that is specific to it and not useful for observability purposes.
The Data Profiler consumes 1 million events at a time and builds the report in real time as those events are being consumed. To consume additional events, use the Rerun Analysis button. This will add an additional 1 million lines into the profile. A single profile can contain up to 3 days worth of events before it needs to be reset. In addition, fields from an event can be mapped into Data Profiler fields to customize the report results (see Step 3).
 ## Step 1: Create an "Exploration" Pipeline
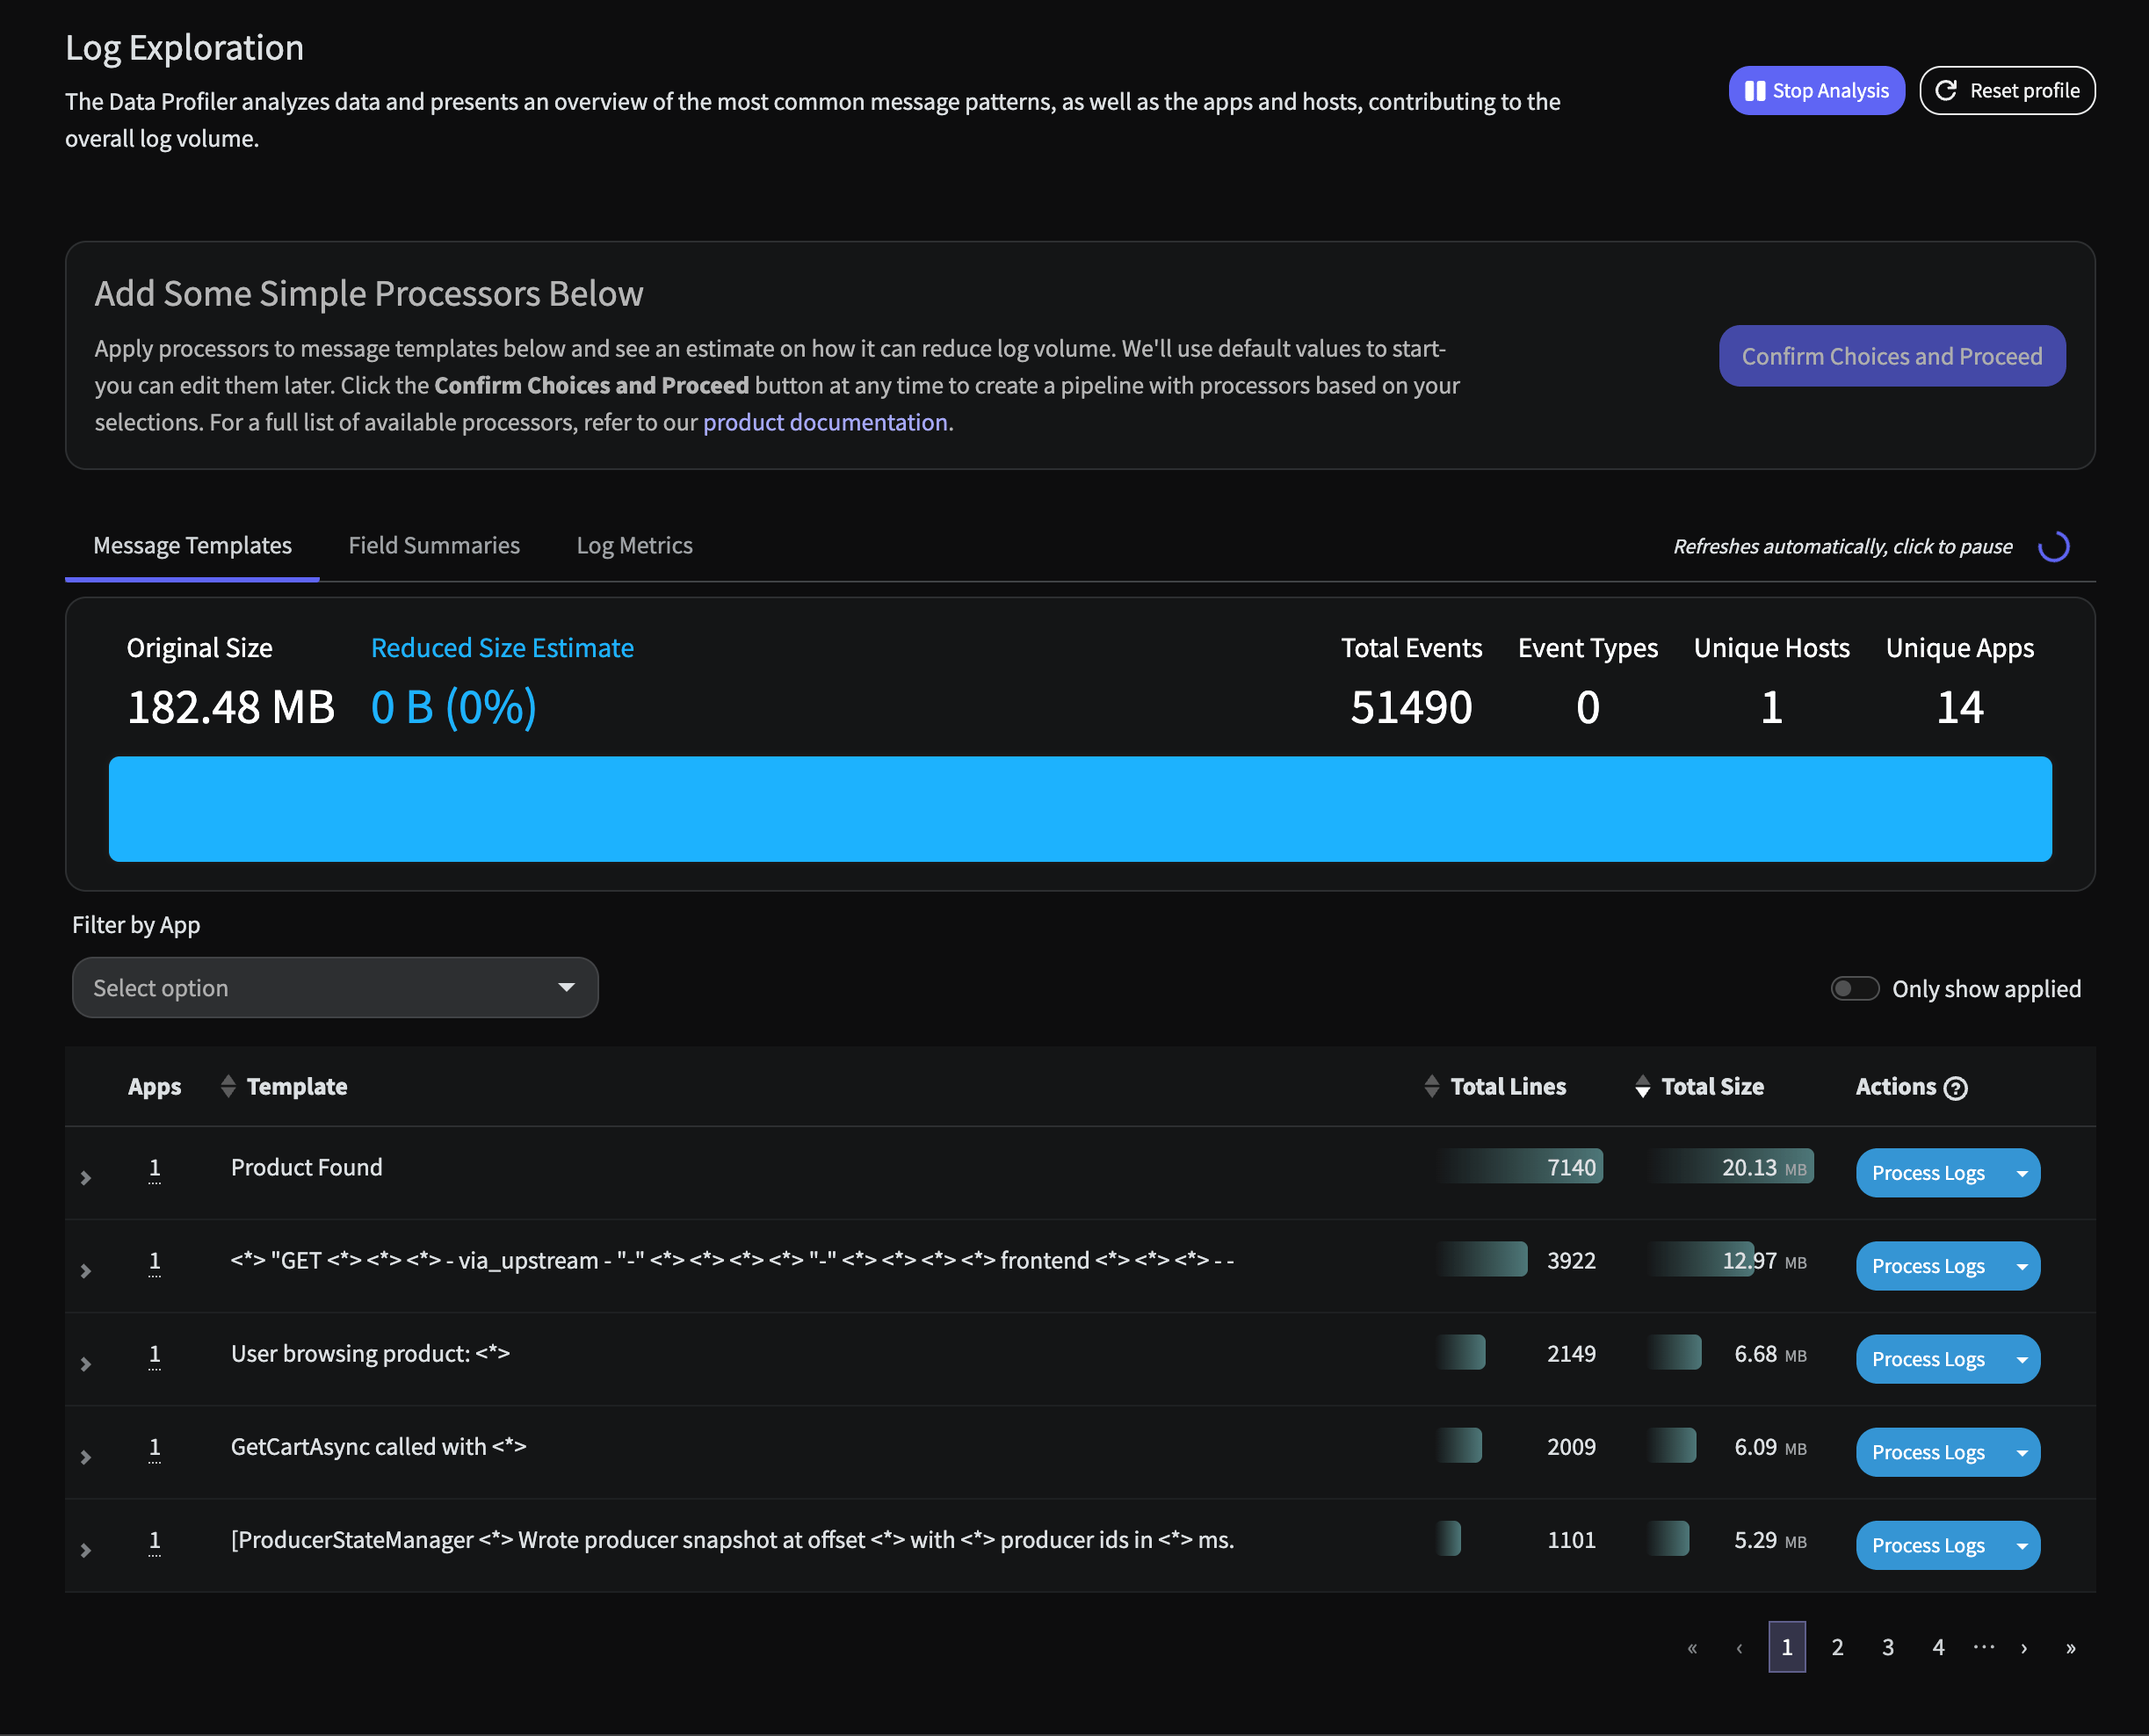
Create a new Mezmo Pipeline by clicking [New Pipeline](https://app.mezmo.com/pipelines/pipeline/new) in the platform. Give this a name like `Log Explorer` and select `Create a blank pipeline`.
## Step 1: Create an "Exploration" Pipeline
Create a new Mezmo Pipeline by clicking [New Pipeline](https://app.mezmo.com/pipelines/pipeline/new) in the platform. Give this a name like `Log Explorer` and select `Create a blank pipeline`.
 ## Step 2: Add OpenTelemetry Log Source
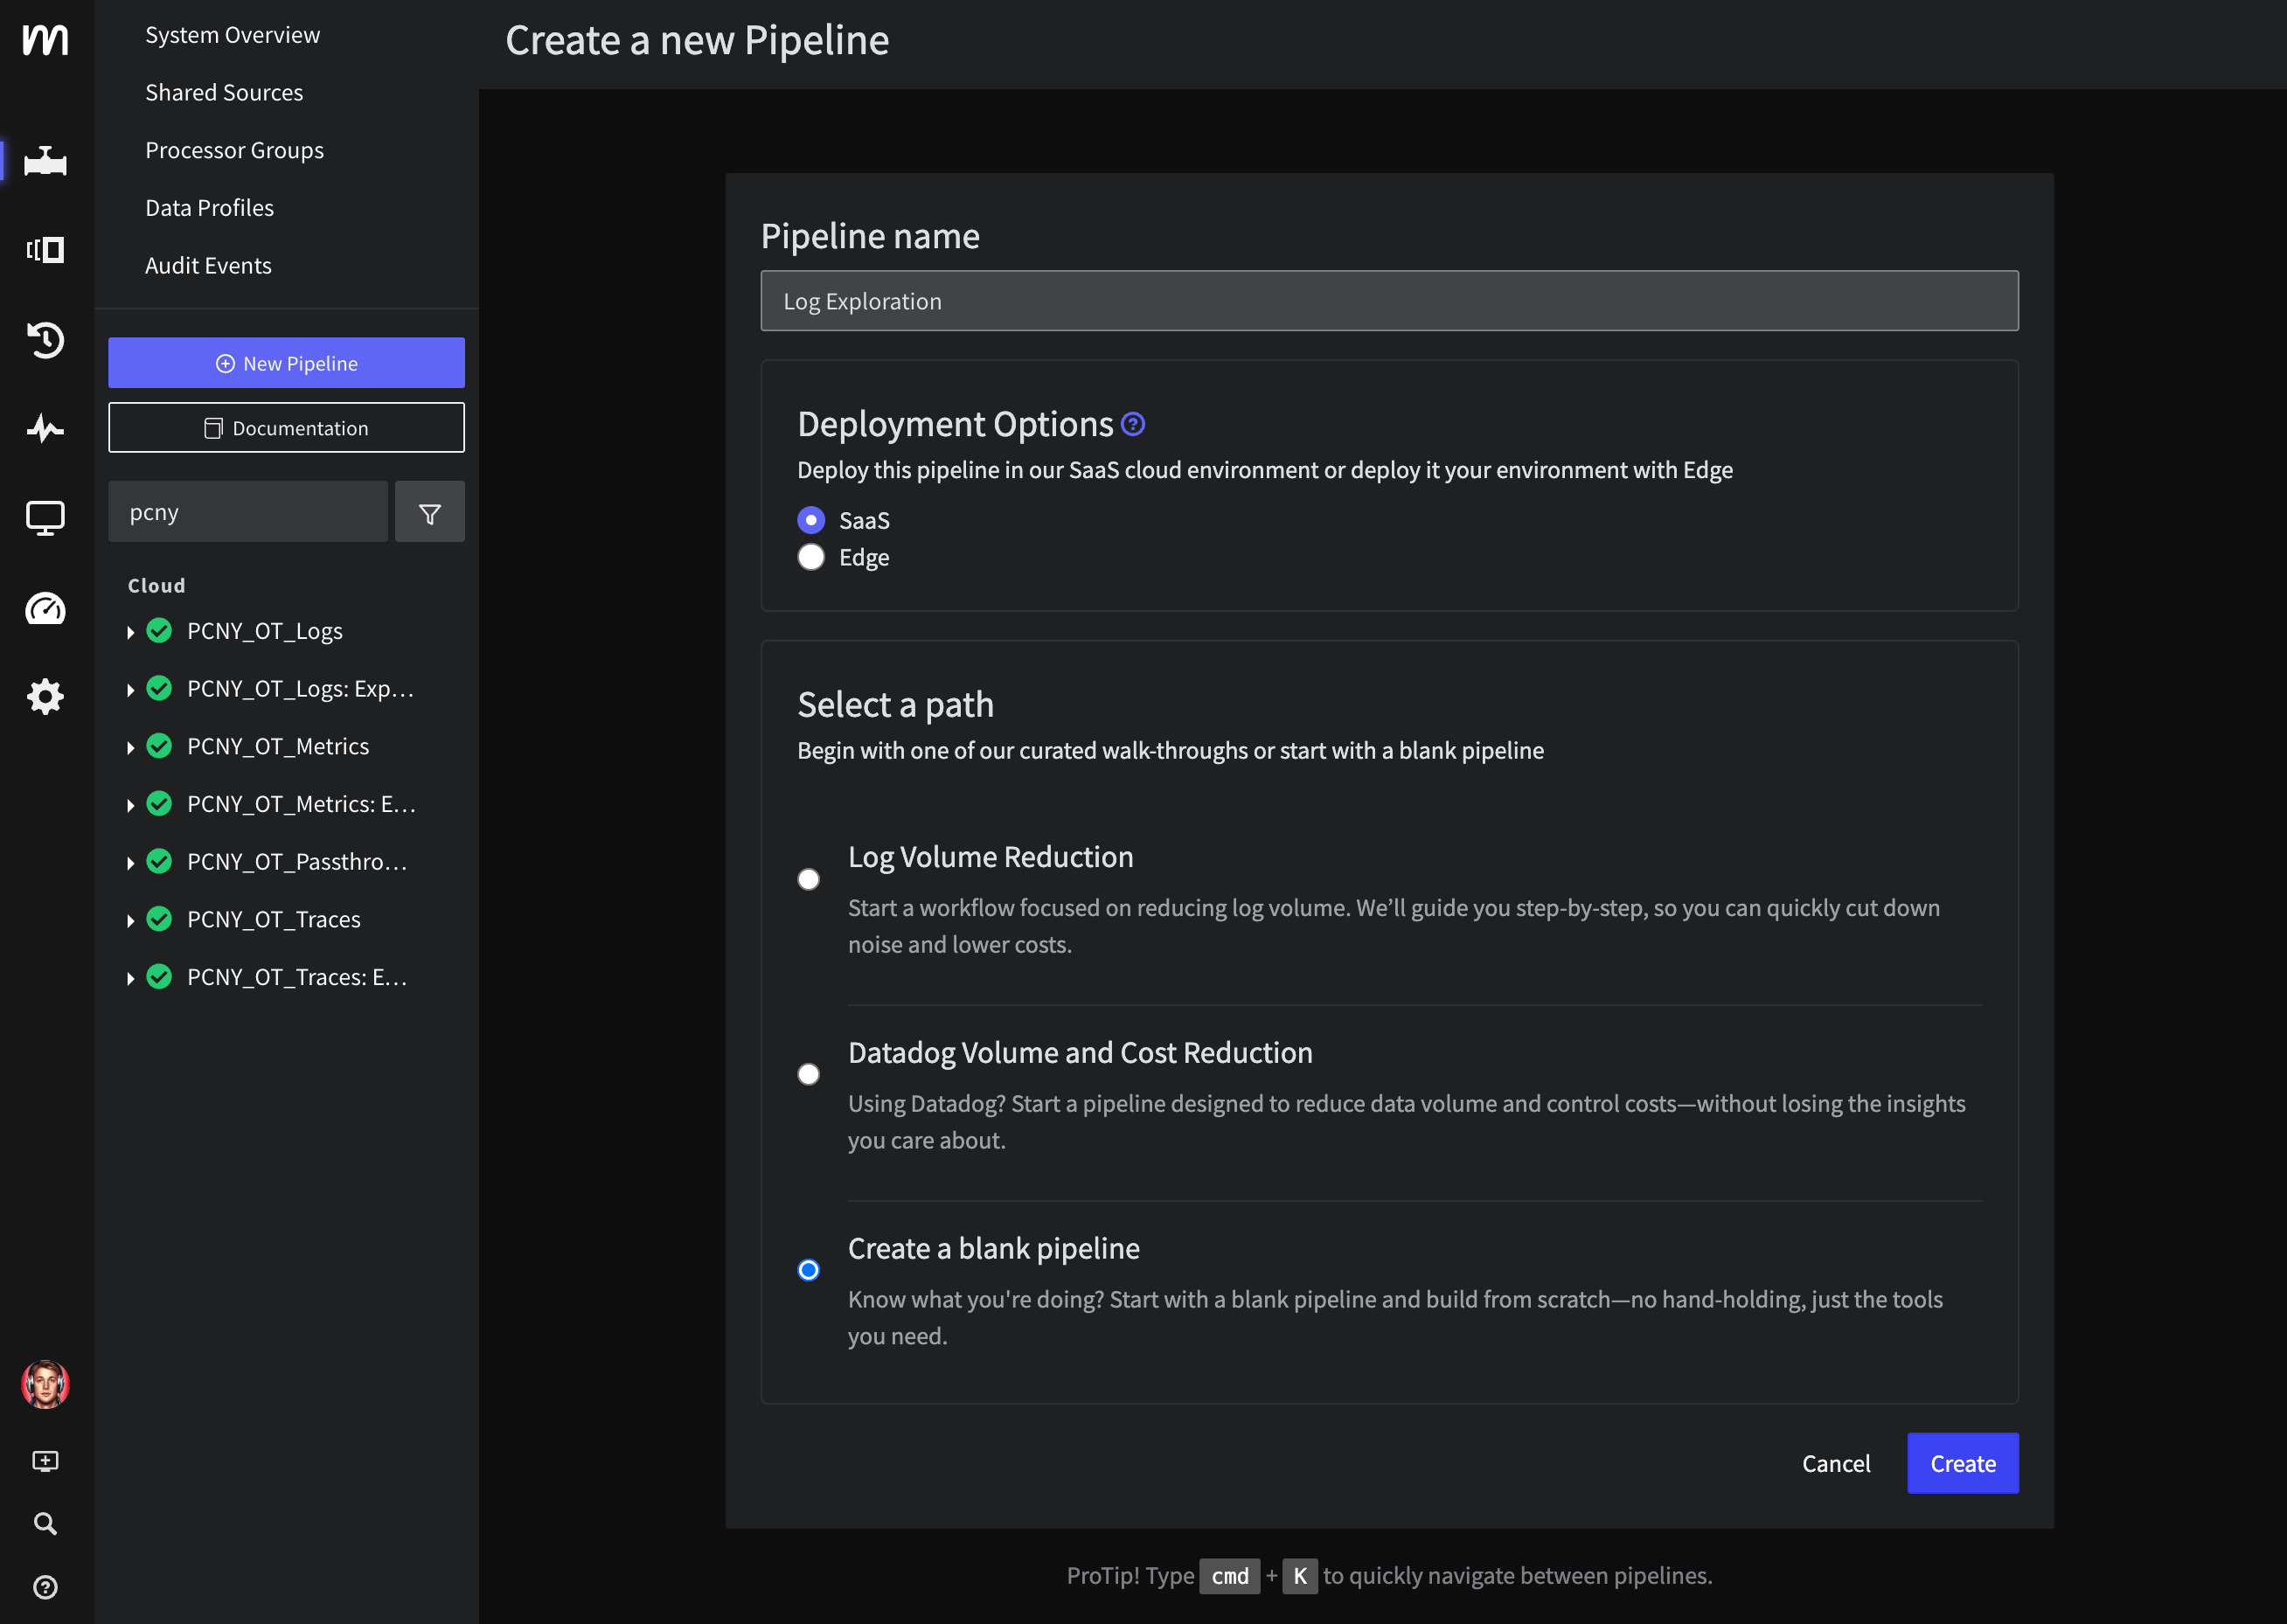
Click `Add Source` and select your OpenTelemetry Log source from the `Shared Sources` list.
## Step 2: Add OpenTelemetry Log Source
Click `Add Source` and select your OpenTelemetry Log source from the `Shared Sources` list.
 ## Step 3: Insert Otel to Profile mapping Script
In order to fully take advantage of the [Mezmo Data Profiler](/telemetry-pipelines/data-profiling), let's modify the structure of this data to increase the insights the profiler provides.
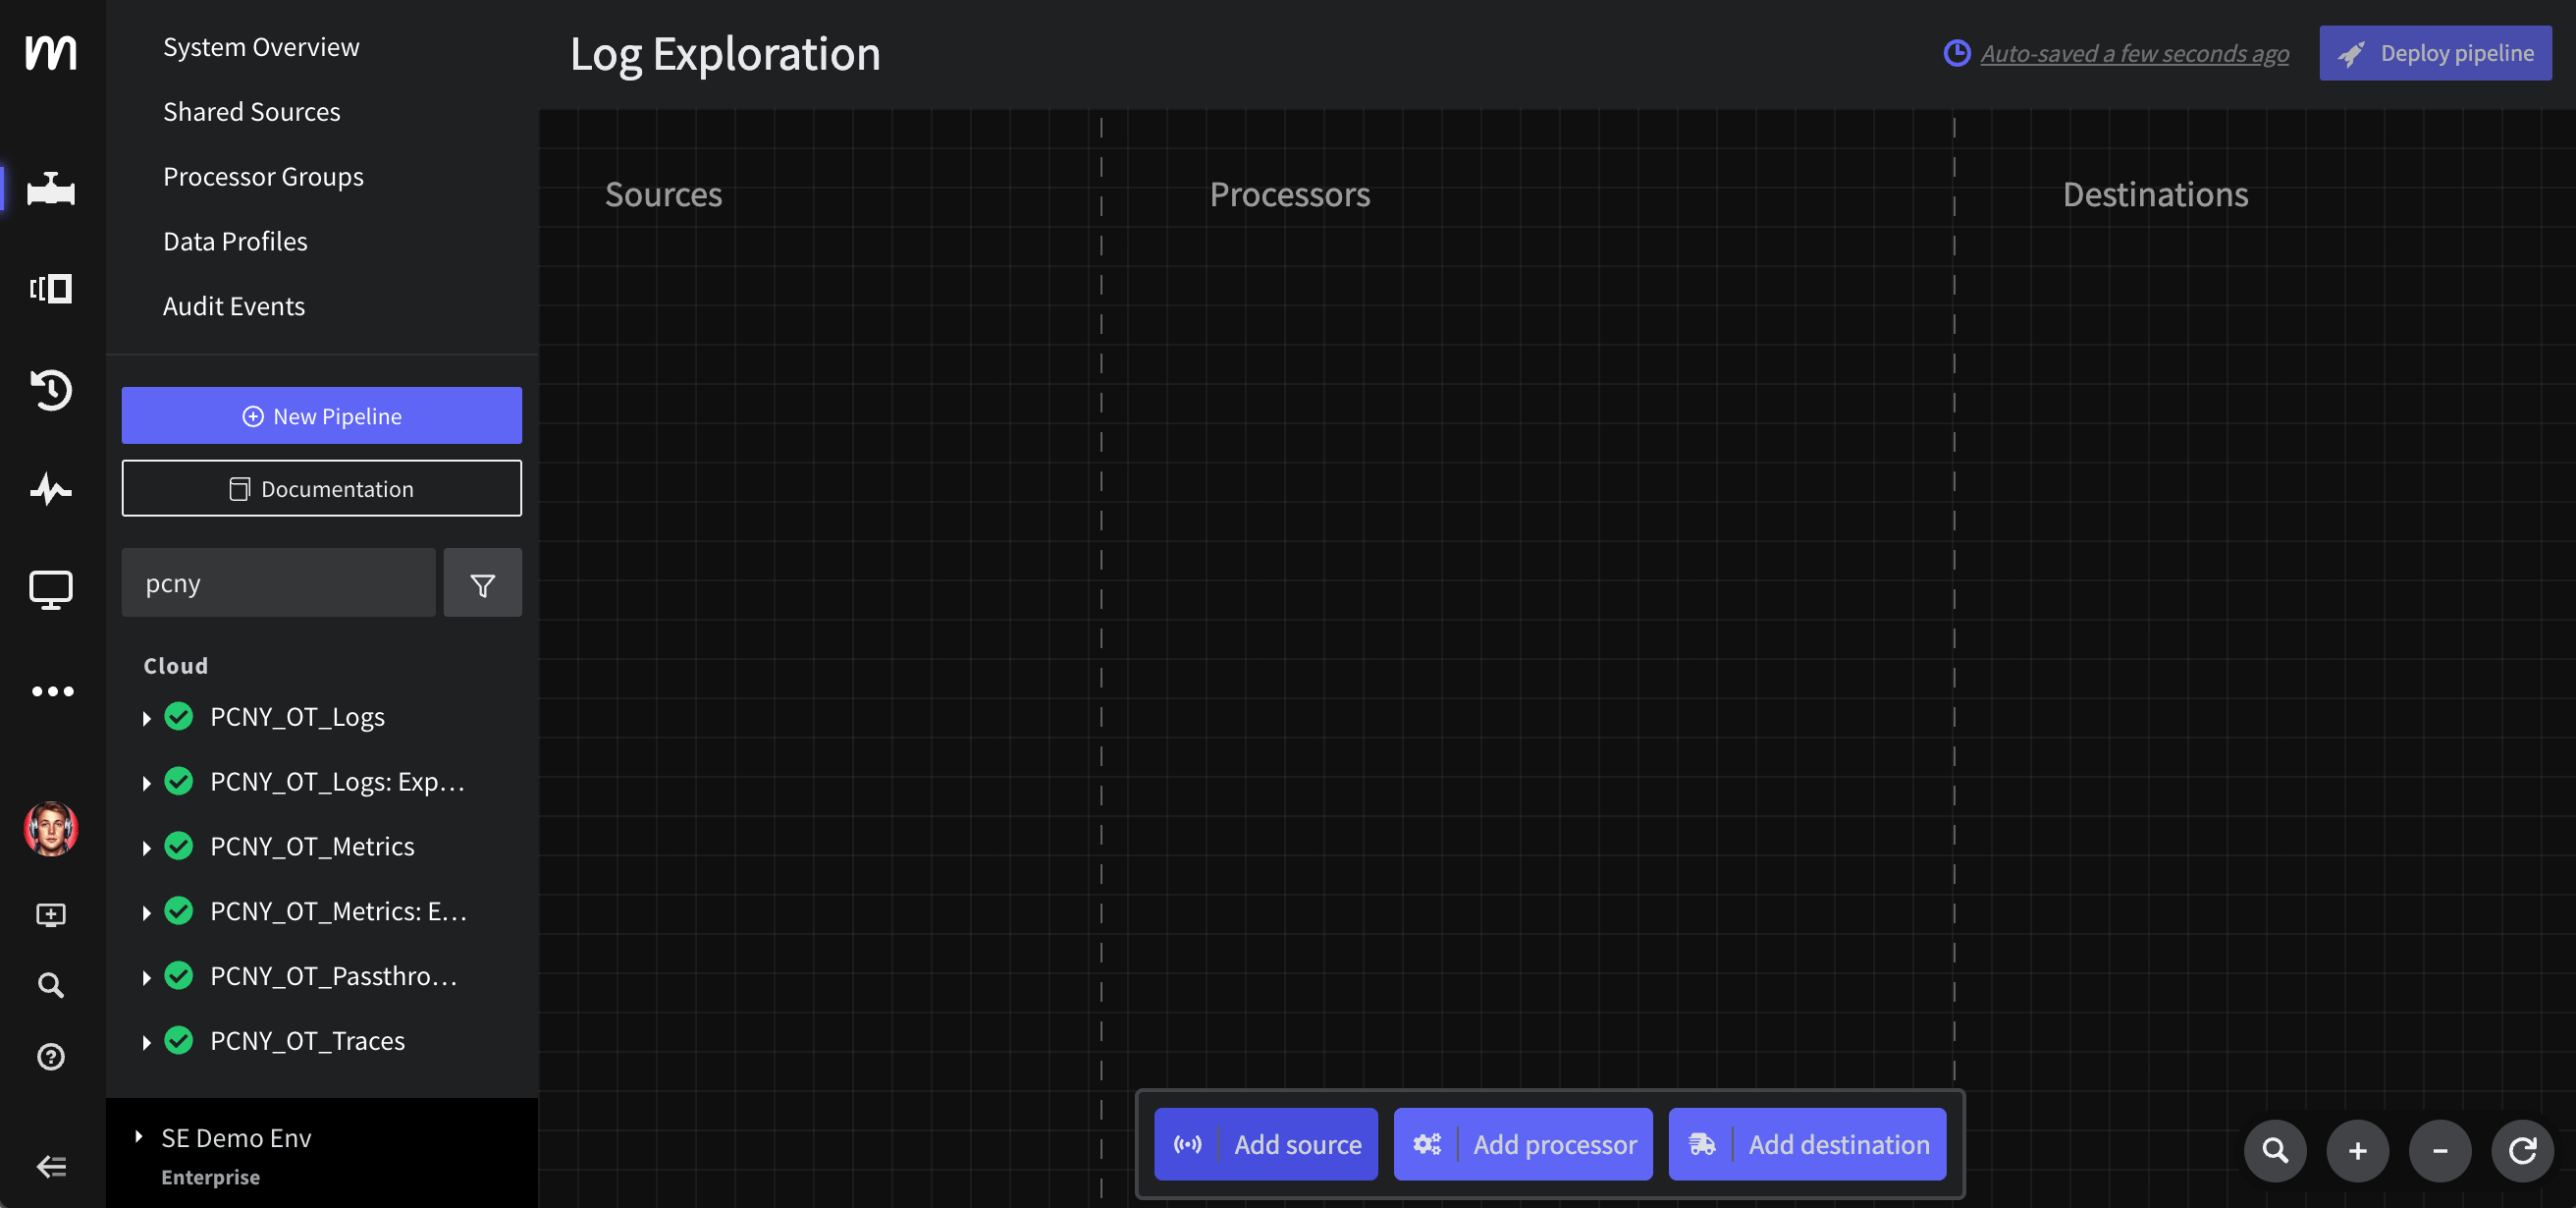
To do this, connect a Script Processor to the Log Source as the first processor and copy in the following code:
```javascript theme={null}
function processEvent(message, metadata, timestamp, annotations) {
let line = message
let app = metadata.resource.attributes["container.name"]
let host = metadata.resource.attributes["container.hostname"]
let level = metadata.level
if( app == null || app == '' ){
app = metadata.resource["service.name"]
}
if( app == null || app == '' ){
app = metadata.resource["service_name"]
}
if( app == null || app == '' ){
app = metadata.scope.name
}
if( app == null || app == '' ){
app = 'na'
}
if( host == null || host == '' ){
host = metadata.headers["x-bus-partition-key"] ?? metadata.headers["x-kafka-partition-key"]
}
if( host == null || host == '' ){
host = metadata.attributes["log.file.path"]
}
if( host == null || host == '' ){
host = 'na'
}
if( level == null || level == '' ){
level = annotations.level
}
let new_msg = {
"line":line,
"app":app,
"host":host,
"level":level
}
// Extract metadata to top level fields
for( const meta of Object.entries(metadata) ){
let meta_name = 'metadataotel_' + meta[0].toString()
let meta_val = meta[1]
new_msg[meta_name] = meta_val
}
return new_msg
}
```
The above script simply maps Otel data to the defaults of Mezmo's profiling nodes. Note that the Profiler is completely configurable and thus mapping is not always needed.
## Step 4: Connect a Profiler node
Add a `Data Profiler` node connected after the Script processor from Step 3. Give it a name like `Otel Demo Log Exploration` and leave the default configuration. To complete the pipeline, add a Blackhole Destination and name it Log Data Dump.
## Step 3: Insert Otel to Profile mapping Script
In order to fully take advantage of the [Mezmo Data Profiler](/telemetry-pipelines/data-profiling), let's modify the structure of this data to increase the insights the profiler provides.
To do this, connect a Script Processor to the Log Source as the first processor and copy in the following code:
```javascript theme={null}
function processEvent(message, metadata, timestamp, annotations) {
let line = message
let app = metadata.resource.attributes["container.name"]
let host = metadata.resource.attributes["container.hostname"]
let level = metadata.level
if( app == null || app == '' ){
app = metadata.resource["service.name"]
}
if( app == null || app == '' ){
app = metadata.resource["service_name"]
}
if( app == null || app == '' ){
app = metadata.scope.name
}
if( app == null || app == '' ){
app = 'na'
}
if( host == null || host == '' ){
host = metadata.headers["x-bus-partition-key"] ?? metadata.headers["x-kafka-partition-key"]
}
if( host == null || host == '' ){
host = metadata.attributes["log.file.path"]
}
if( host == null || host == '' ){
host = 'na'
}
if( level == null || level == '' ){
level = annotations.level
}
let new_msg = {
"line":line,
"app":app,
"host":host,
"level":level
}
// Extract metadata to top level fields
for( const meta of Object.entries(metadata) ){
let meta_name = 'metadataotel_' + meta[0].toString()
let meta_val = meta[1]
new_msg[meta_name] = meta_val
}
return new_msg
}
```
The above script simply maps Otel data to the defaults of Mezmo's profiling nodes. Note that the Profiler is completely configurable and thus mapping is not always needed.
## Step 4: Connect a Profiler node
Add a `Data Profiler` node connected after the Script processor from Step 3. Give it a name like `Otel Demo Log Exploration` and leave the default configuration. To complete the pipeline, add a Blackhole Destination and name it Log Data Dump.
 ## Step 5: Deploy
Finally, you must deploy your pipeline in order to start exploring your log data.
*
## Step 5: Deploy
Finally, you must deploy your pipeline in order to start exploring your log data.
*
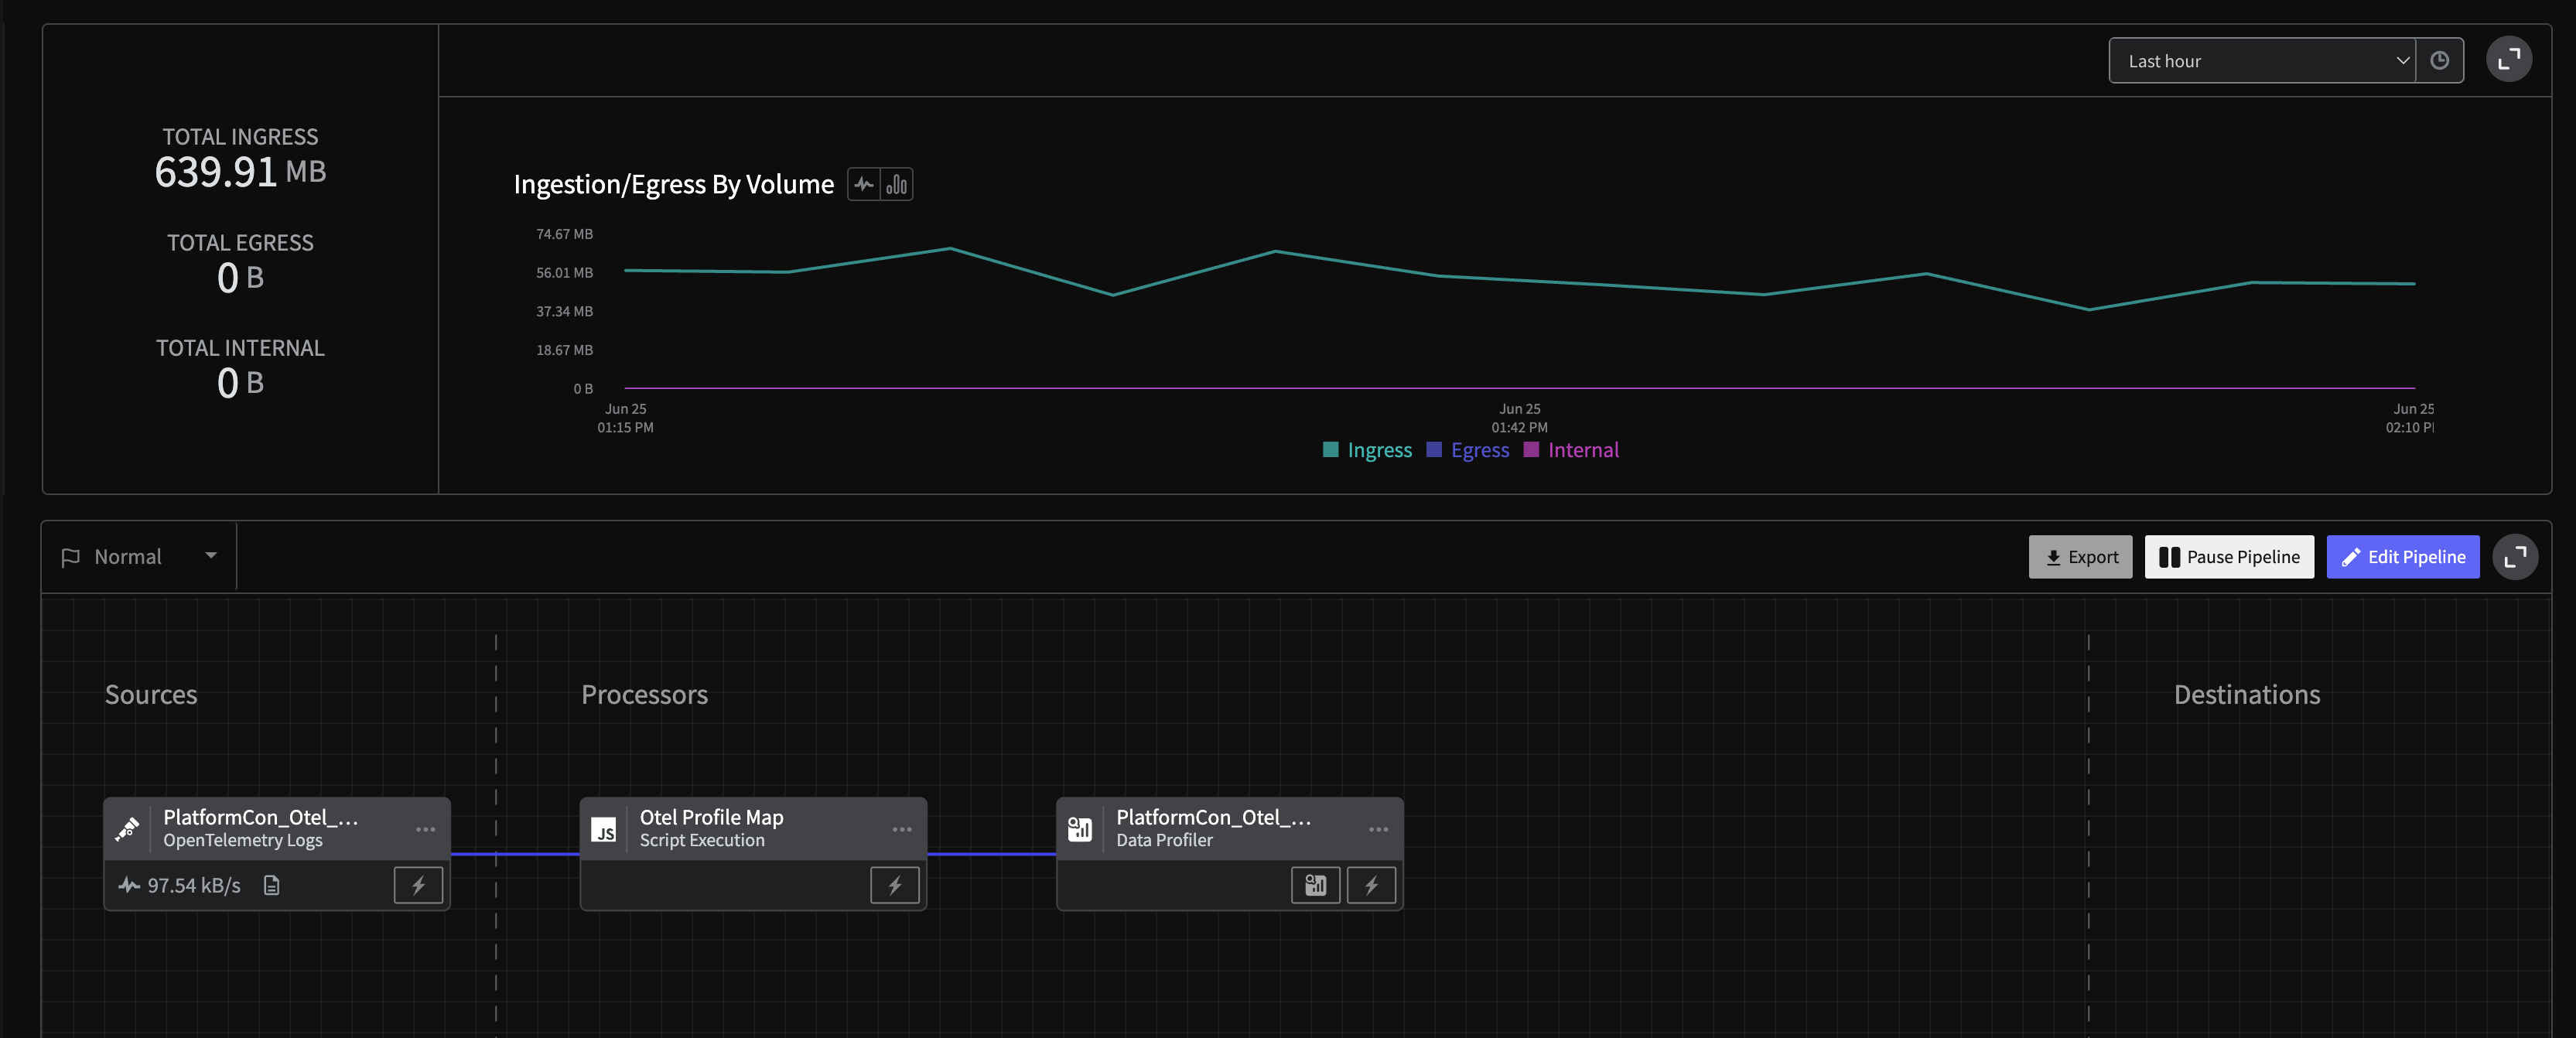 ## Step 6: Analyze Log Patterns
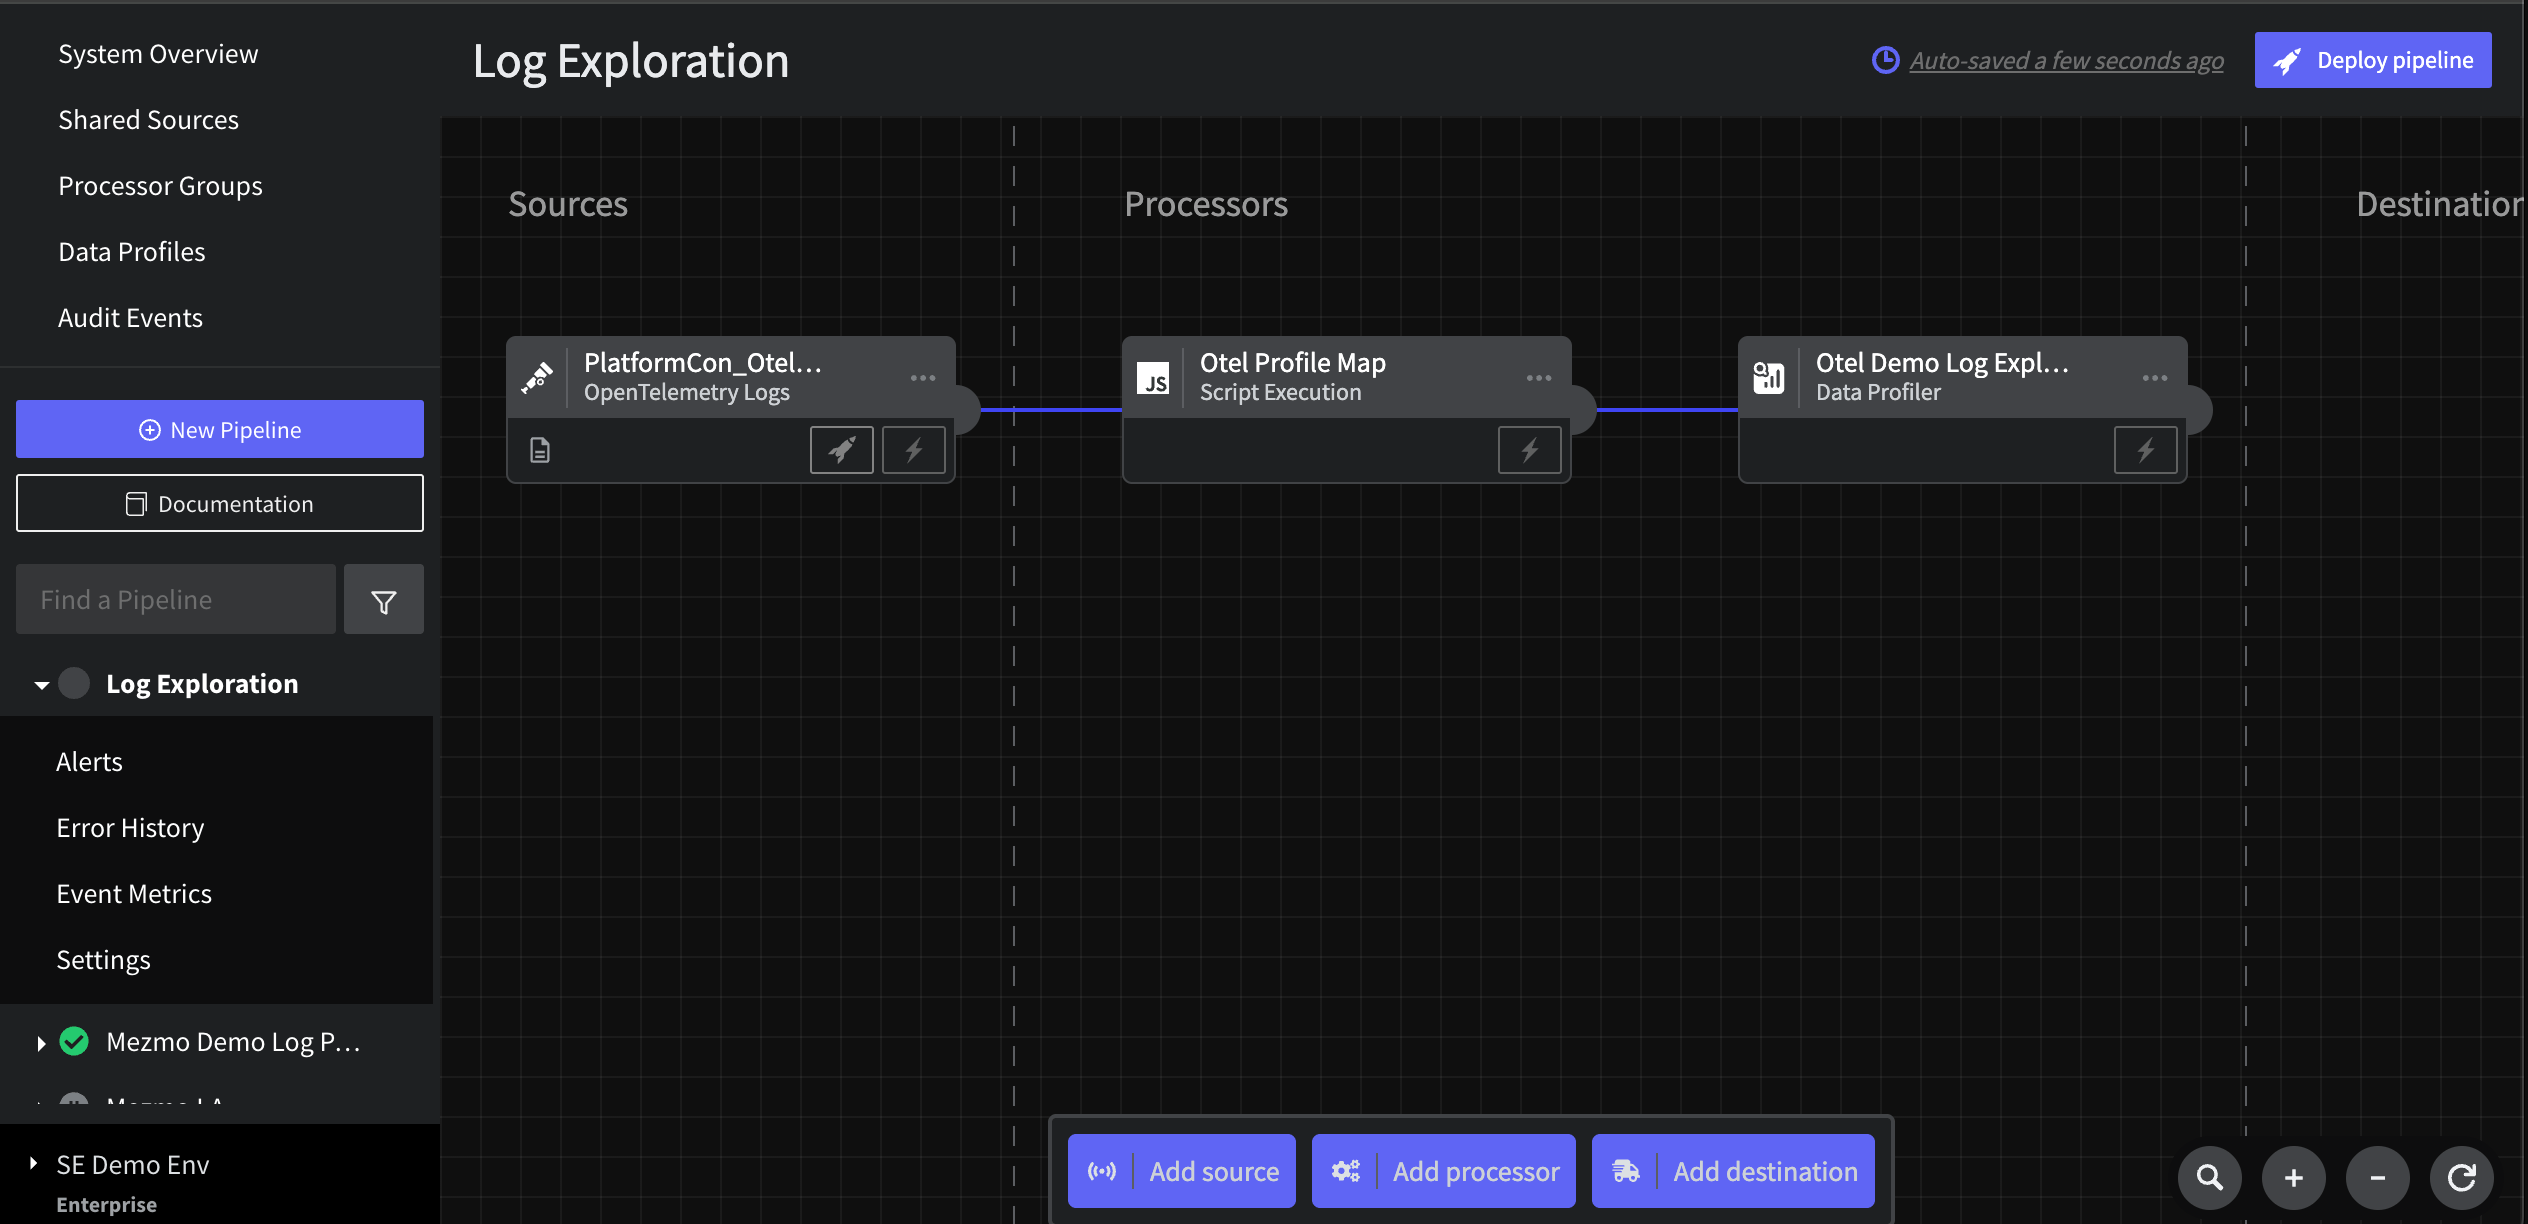
Once your data profiling pipeline has been built and deployed, the profiler report will build real time in a few seconds. Within minutes, you will see something similar to the following
## Step 6: Analyze Log Patterns
Once your data profiling pipeline has been built and deployed, the profiler report will build real time in a few seconds. Within minutes, you will see something similar to the following
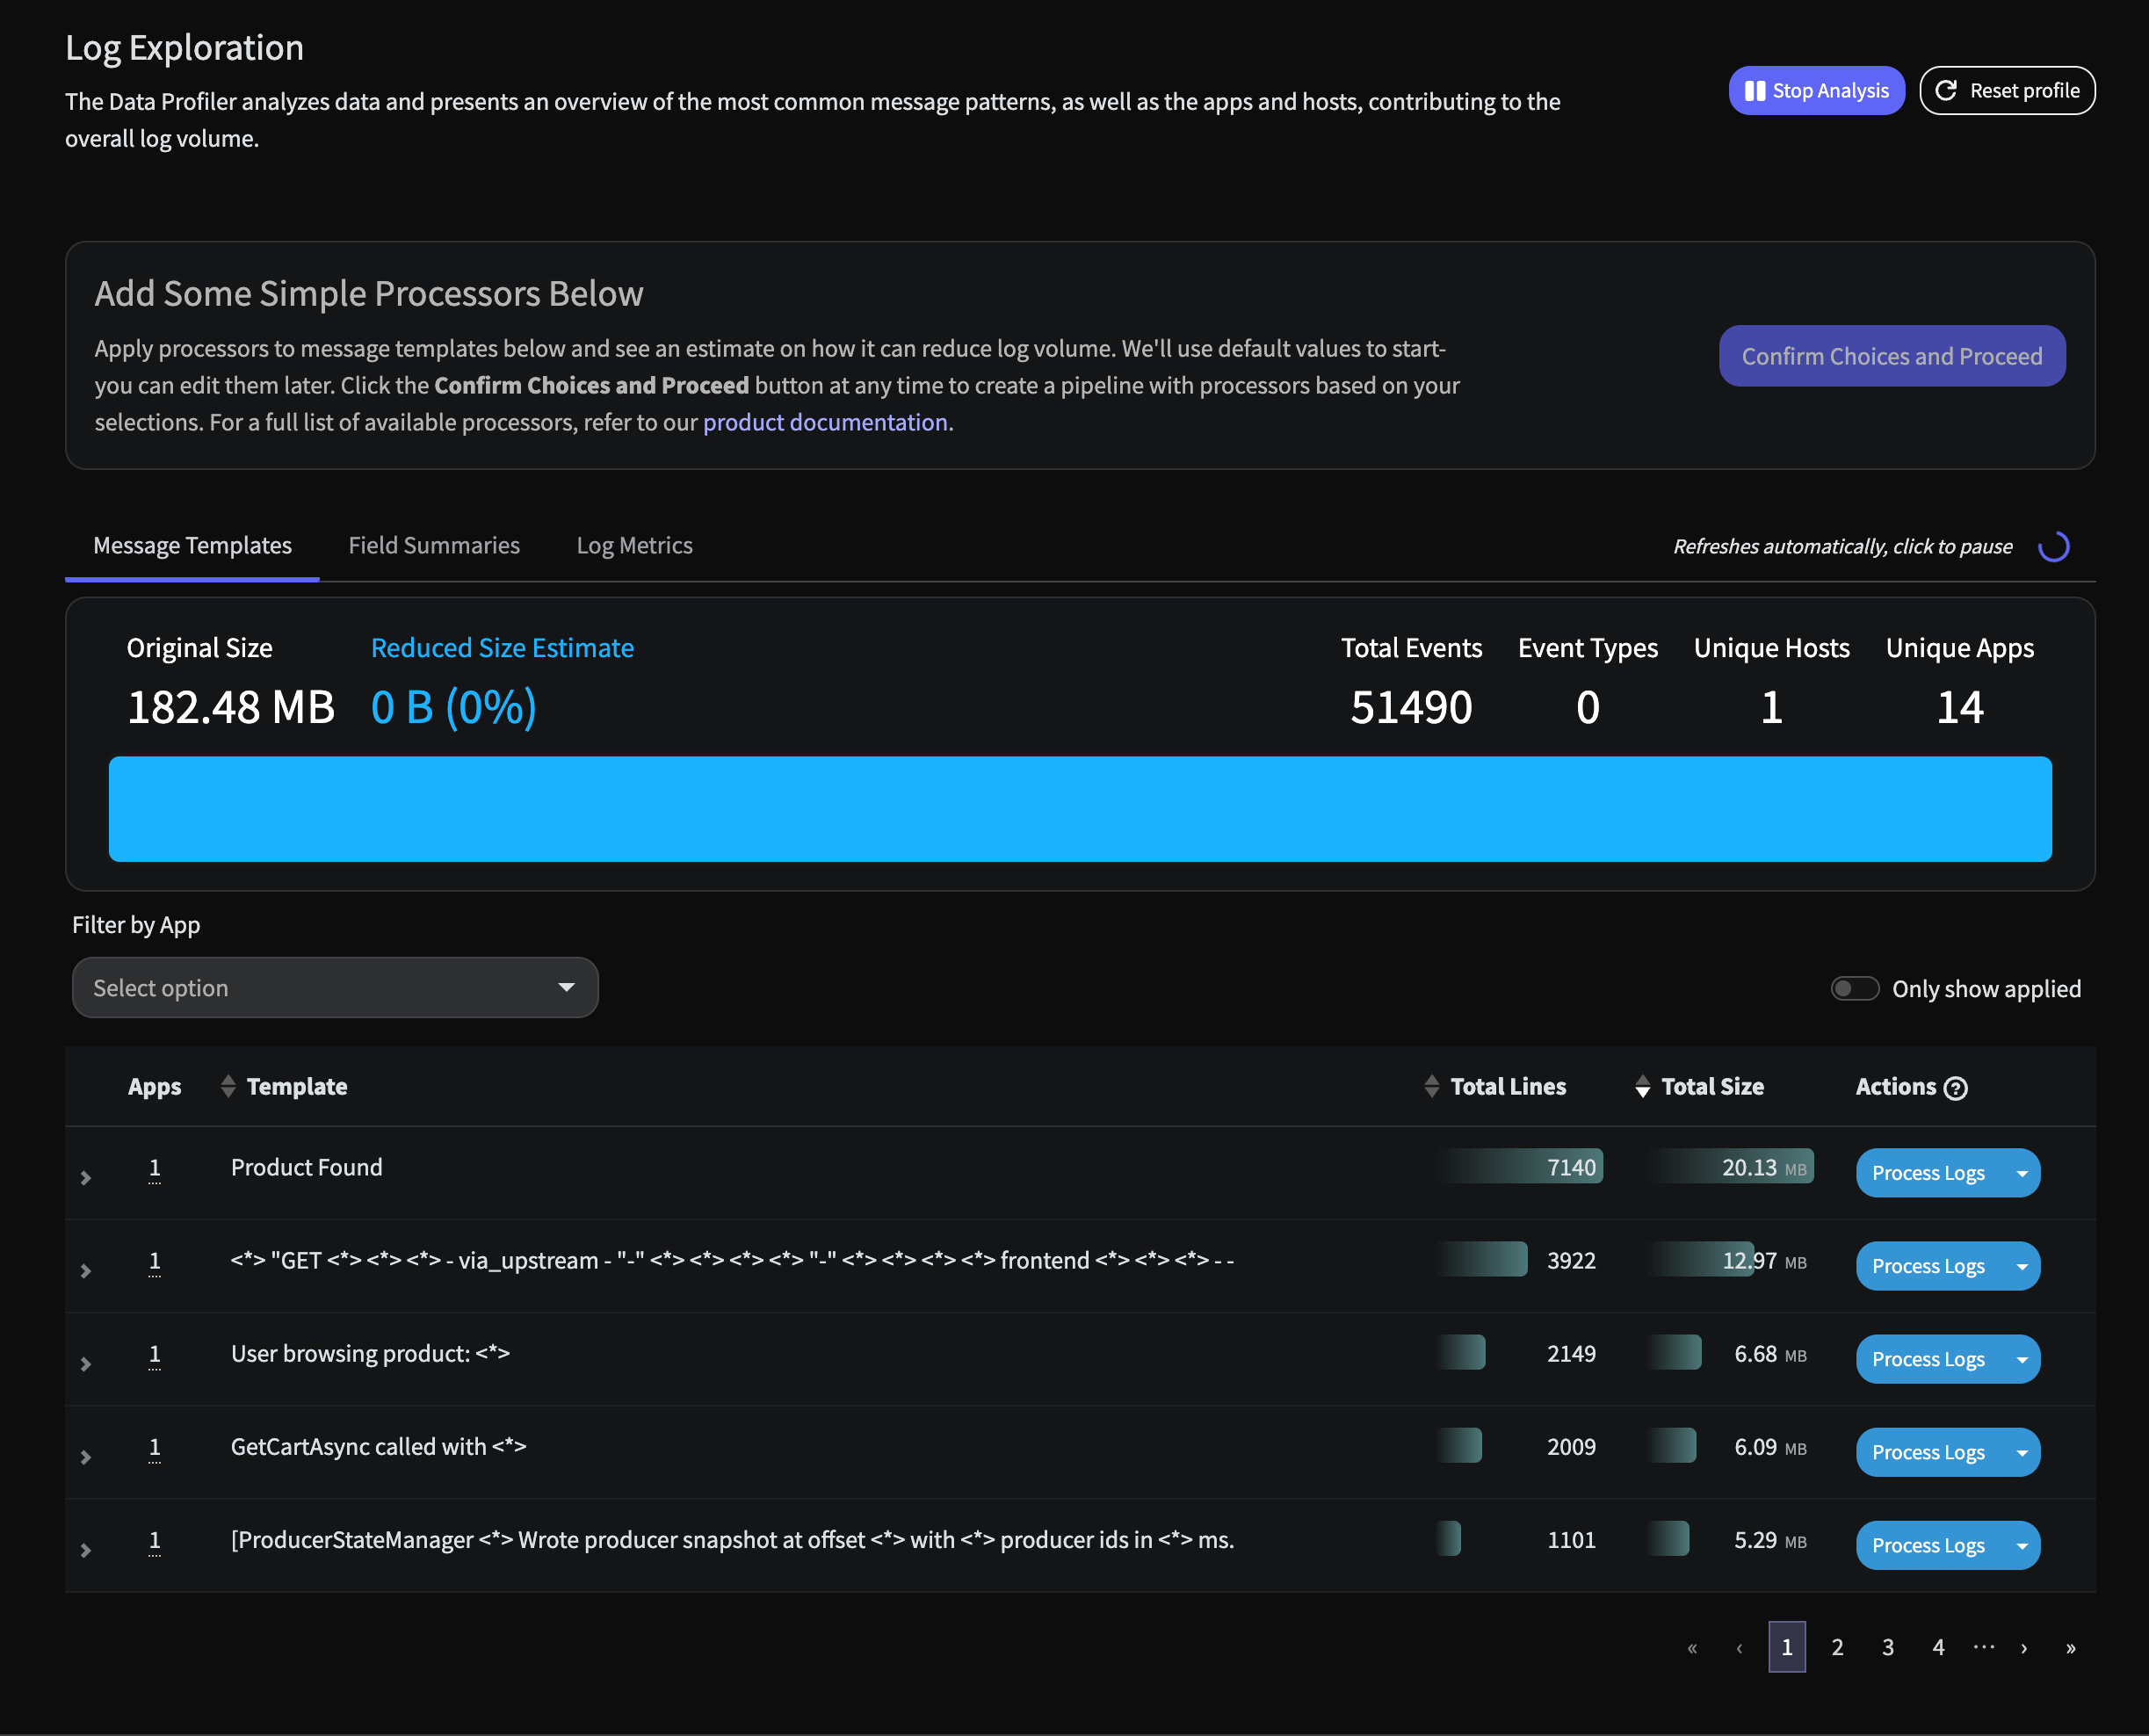 Immediately there are two insights of note:
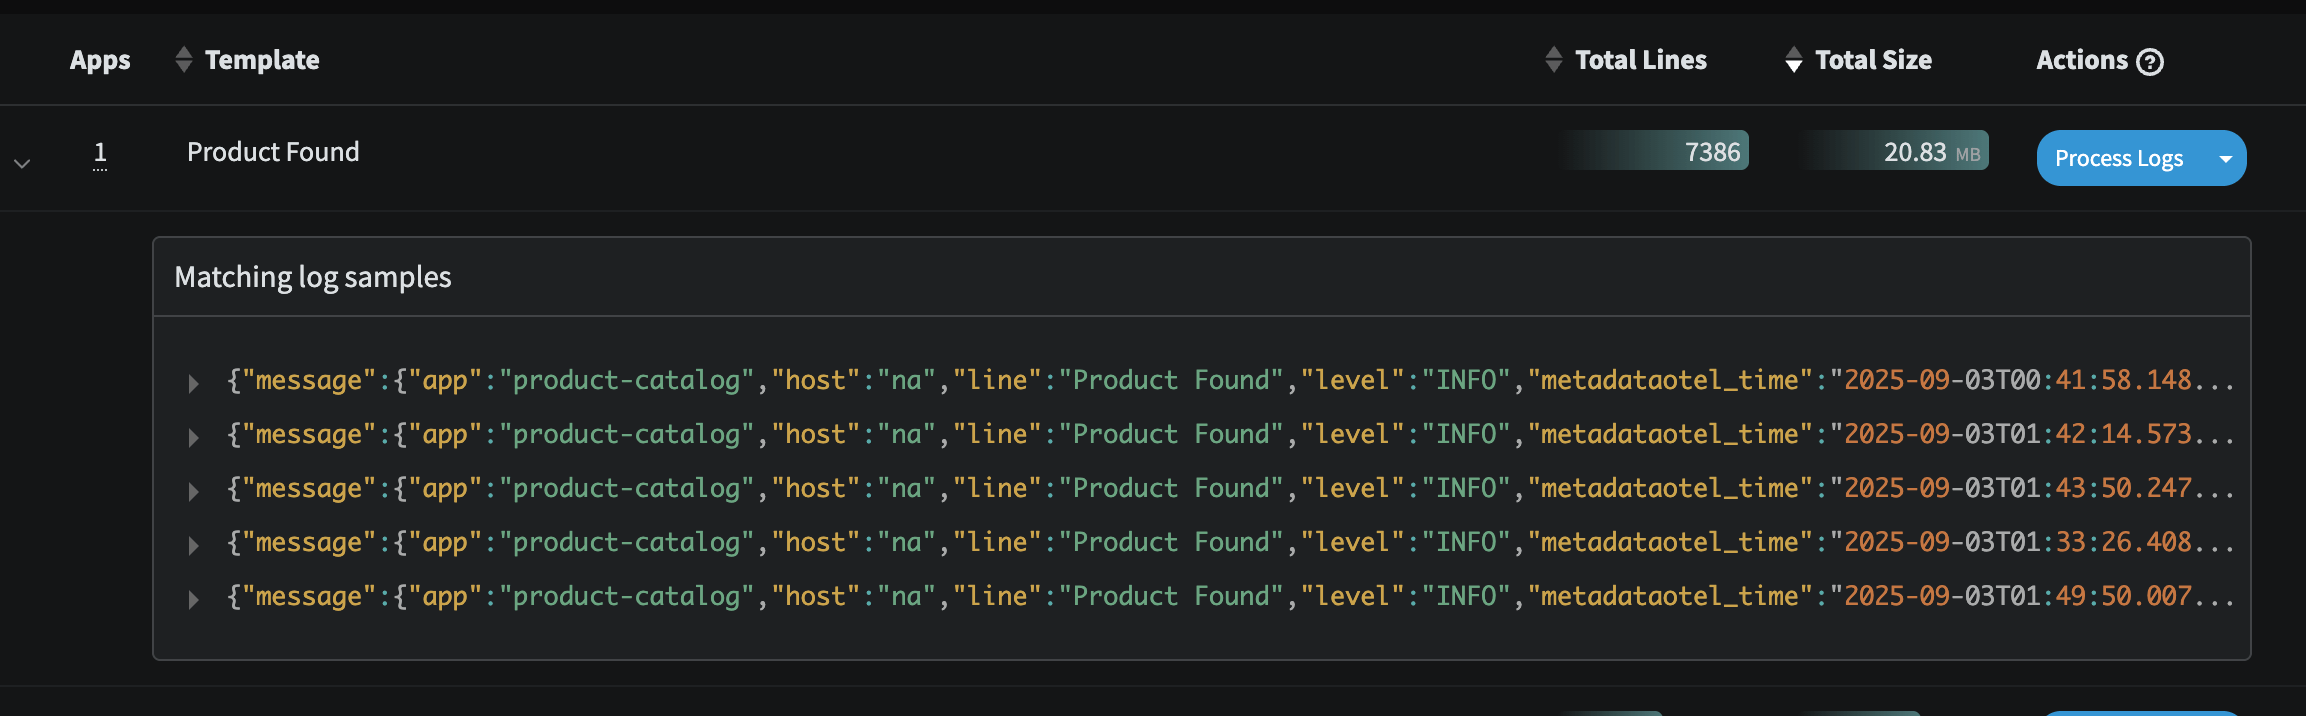
1. There is an inordinate amount of **logs simply stating a Product has been found** coming from the `product-catalog` service. This is standard type of message that contains metadata on which product was found, but it can be quite costly to retain each and every one of these.
Immediately there are two insights of note:
1. There is an inordinate amount of **logs simply stating a Product has been found** coming from the `product-catalog` service. This is standard type of message that contains metadata on which product was found, but it can be quite costly to retain each and every one of these.
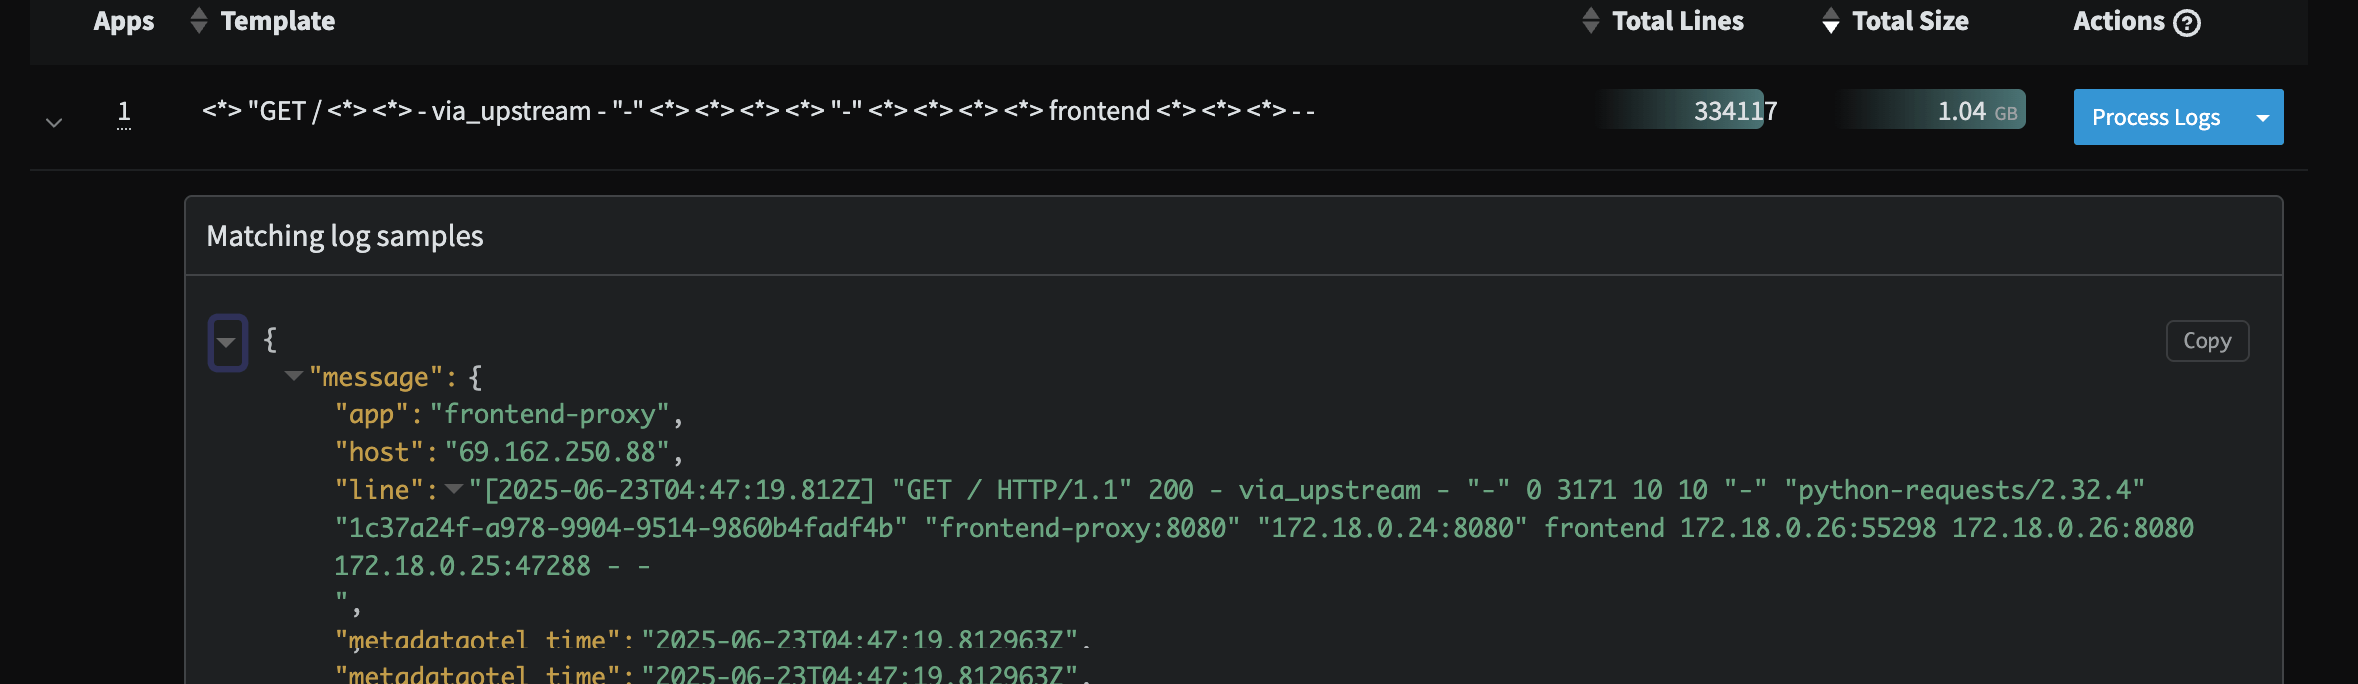
 2. Unparsed events that appear to be custom Apache logs from the `frontend-proxy` service. While these are [defined in the demo code here](https://github.com/braxtonj/opentelemetry-demo/blob/main/src/frontend-proxy/envoy.tmpl.yaml#L80), we can ensure this data is structured and parsed properly to be fully searchable in any downstream Observability system.
 In the next section, we will build out a log data optimization pipeline to address both these concerns.